
As a client / server solution, Mitutoyo's MeasurLink gives you the performance you need through distributed processing. Combined with a multi-user relational database,
MeasurLink delivers a safe and organized data warehousing system making quality data available for viewing and analysis by any member of the production, engineering, and managerial staff throughout your company. Inspection in the factory produces data for analysis, corrective action, and various reporting needs. As the backbone of your quality efforts, MeasurLink is guaranteed to reduce your production costs and increase your bottom line.
To shop our Mitutoyo Measurlink SPC Software Selection, Click Here.
Click Here to view MeasurLink SPC Software Videos.
Click Hereto view MeasurLink SPC Software PDF Brochure.
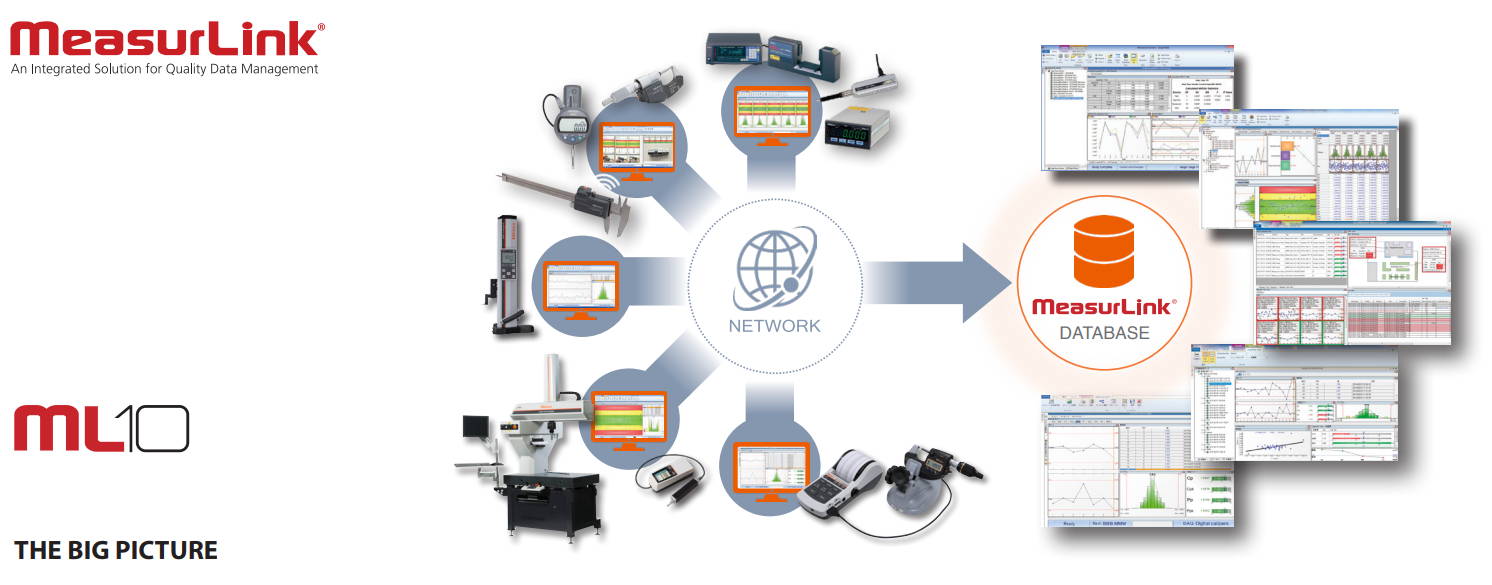
SCALEABLE DATA ACQUISITION, MANAGEMENT & ANALYSIS
MeasurLink® is Mitutoyo’s Data Collection and Real-Time SPC software. It is used in all industries to collect and analyze data to improve the manufacturing process. MeasurLink® supports Real-Time data collection with live SPC charts to alert operators, and additional alerts, analysis tools, and reports for Quality Control and Operations.
- Real-Time Standard allows data collection from each tool and instrument while allowing real-time display of statistical processing data such as control charts, histograms and process capability indices.
- Real-Time Professional additionally supports filter, Import Templates and DDE DAQ Sources.
- Real-Time Professional 3Dadditionally supports view of the workpiece using 3D CAD data. (HOOPS).
- Process Analyzer A powerful supervisory tool for viewing, analyzing and reporting on all data collected at any Real-Time station on the network. Additional charting options and management friendly reports provide insight on the manufacturing process.
- Process Manager enables centralized monitoring of information from all MeasurLink data collection terminals networked together on the shop floor.
- Report Scheduler automatically outputs reports created by Real-Time or Process Analyzer on a user defined schedule.
- Gage Management plans and implements a complete calibration schedule and incorporates a powerful retrieval function in addition to recording and managing the operational state of gages.
- Gage R&Ris an evaluation and analysis software compliant with MSA required in ISO/TS 16949.
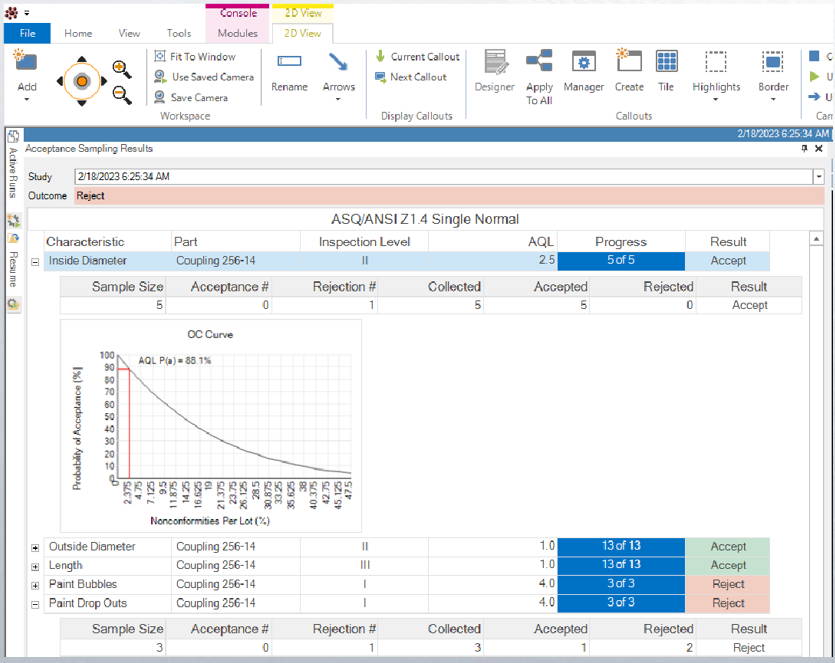
Acceptance Sampling
- Reduced cost of receiving inspection
- Increased confidence in supplier quality
- Faster reaction to supplier quality issues
- Less risk of supplier defects impacting other processes

Mitutoyo has been developing MeasurLink and serving manufacturing quality programs for almost
30 years. It represents the design input of industry experts and thousands of manufacturers across the globe. It is quality management, inspection and analysis software built on a technology platform for the most robust performance and reliability.
why mitutoyo's measurlink is leading the way
MeasurLink® can serve the smallest shop to the largest multi-national enterprise with the most ease of use and power available in SPC software today. It is designed with Industry 4.0 and Smart Factory in mind and provides the scalability, extensibility and interoperability needed in today's factory.

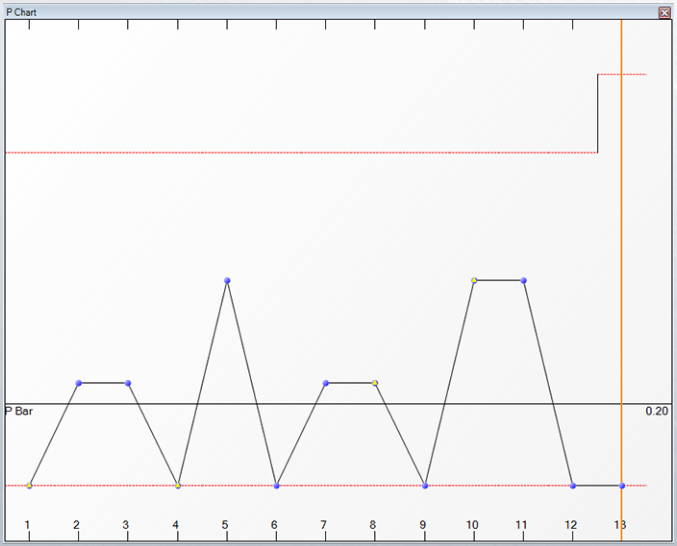
the advantages of attributes - p count
The most commonly used attribute control chart is the p chart. The p chart is used specifically to control the fraction or proportion non-conforming. The fraction non-conforming is the ratio or the quantity non-conforming divided by the quantity of parts.
The p chart is used for several reasons:
- On processes that use go no-go gaging such as plug gages, ring gages and functional gages.
- In inspection areas to monitor or control the fraction non-conforming from the shop or supplier.
- In situations where visual inspection is performed.
- Other attribute situations where the fraction (or proportion) non-conforming requires control.
- Attribute inspection where sample size varies.
Real-Time Standard
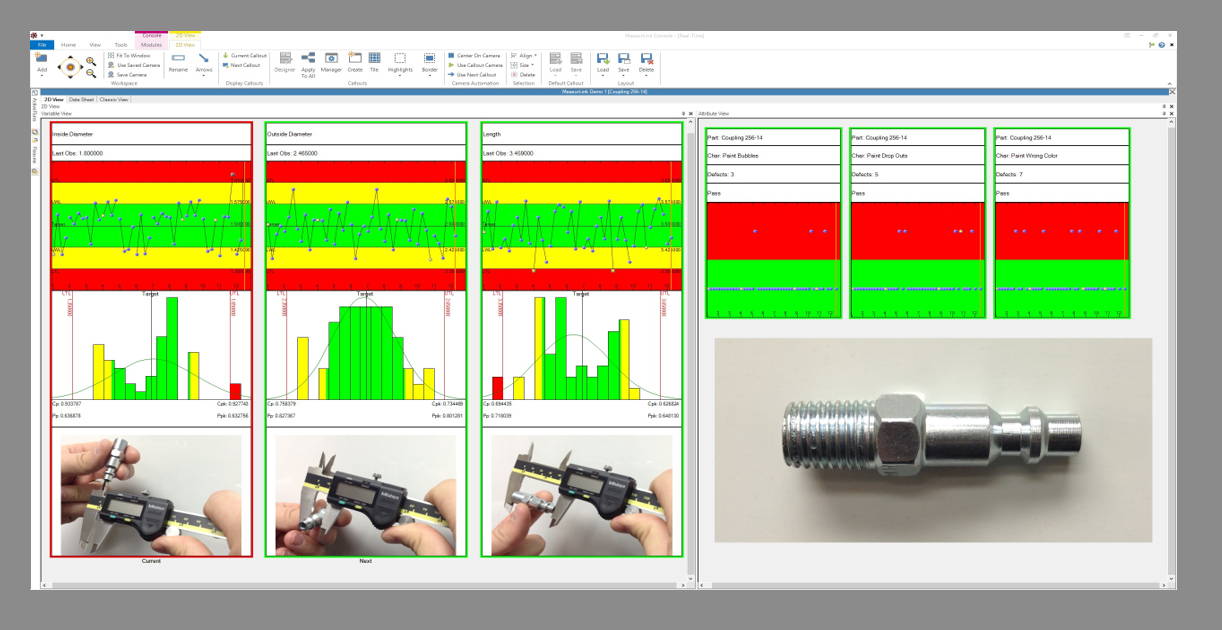
Use MeasurLink® Real-Time Standard Edition to acquire and analyze data in real-time and check variable and attribute inspection to to control your process and minimize defects.
Designed to collect data at the point of manufacture, operators can be alerted of trends, cycles, and nonconformance as soon as they occur. A customizable user interface allows the user nearly infinite ways to view information specific to that process. MeasurLink® Real-Time has the ability to connect and acquire data from virtually any measuring device.
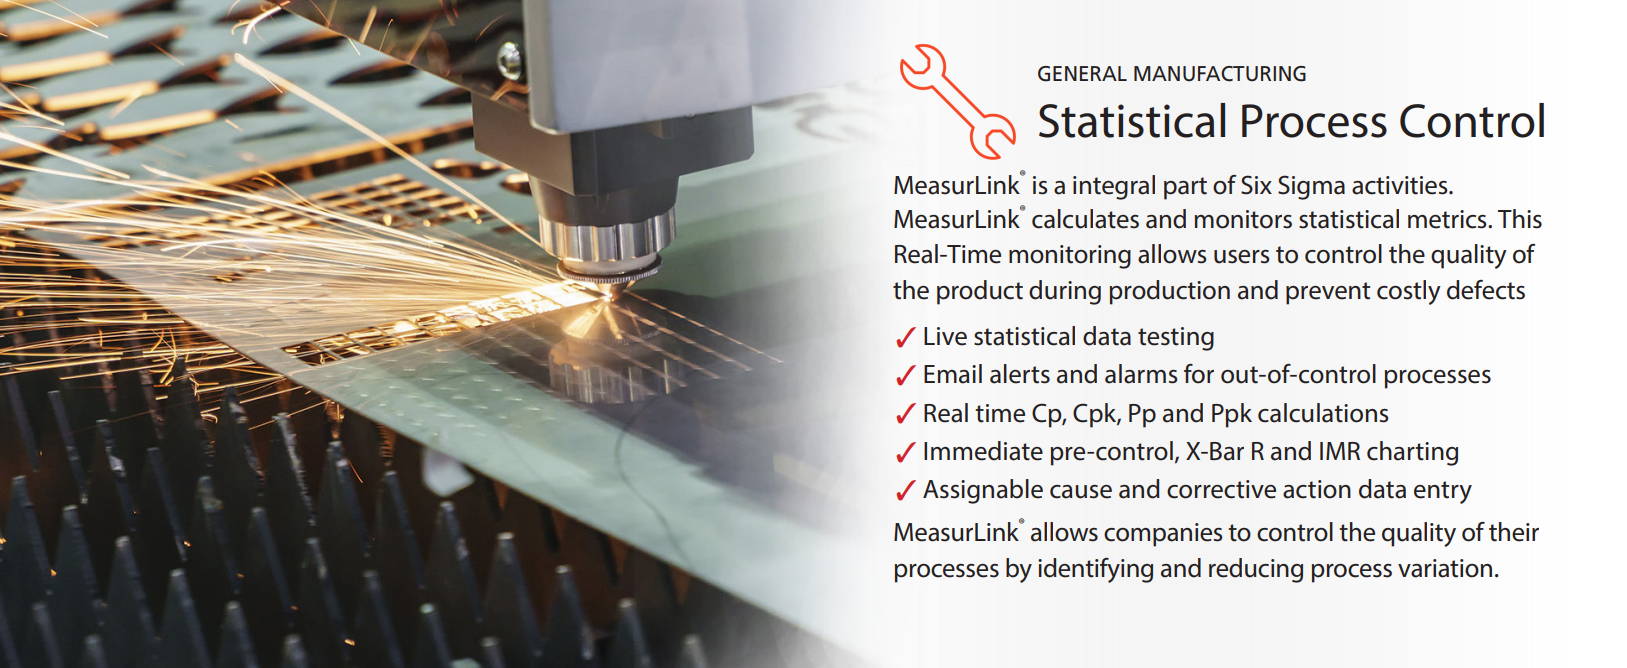
Features & Benefits
User Friendly
Click a gage button and watch the charts update in real-time. This helps the operator stay on top of the process. Begin collecting data in minutes with Inspection Wizard.
Part Pictures
View scanned blueprints, digital photographs at a glance. On-screen guided sequencing keeps the operator moving to the right feature.
Comprehensive SPC
Easy-to-use Control Charts, Histograms,
Capability, Detailed statistics, Assignable Causes, Corrective Actions, and Traceability all make this software “best in class”.
Variable Collection Frequency
Allows characteristics of the same routine to be measured at different intervals while maintaining appropriate prompted guided sequencing.
Multimedia Aids
Attach movies (AVI, MOV, MPG), sound (WAV) and images (BMP, JPG, TIF) to parts, routines or individual characteristics as instructional aides for an operator.
Revision History
Track specification adjustments and preserve historical data.
Data Acquisition and Input
Collects data from digital micrometers, calipers, indicators, bore gages, etc. Keyboard entry is a snap. Collect data for one or a million parts. Begin collecting data in 60 seconds with a “Quick Run” by defining features, tolerances and input method. Flexible data input. Collect data by feature, by part or randomly. Guided sequencing minimizes inspection errors.
Mixed and Attribute Variable Data
Collect dimensional data (length, width, height, outside diameter, inside diameter weight, etc.). Supports derived features (calculations for run out, volume, true position, etc.) Mix your dimensions and non conformances in the same Inspection Routine. Track defects and defectives along with your dimensional data. Collect data from visual inspections (burrs, cracks, dents, missing holes, etc.) to determine the fitness of a part. Track failures using a go/no-go style or count the defects on a characteristic to determine if a part is defective. There is complete flexibility to study the individual characteristics and as a group of them, too.
Engineering Specifications
Attach drawings to parts, routines or individual characteristics for viewing. Most file formats are supported as an attachment (e.g.
Word, PDF).
Data Tests
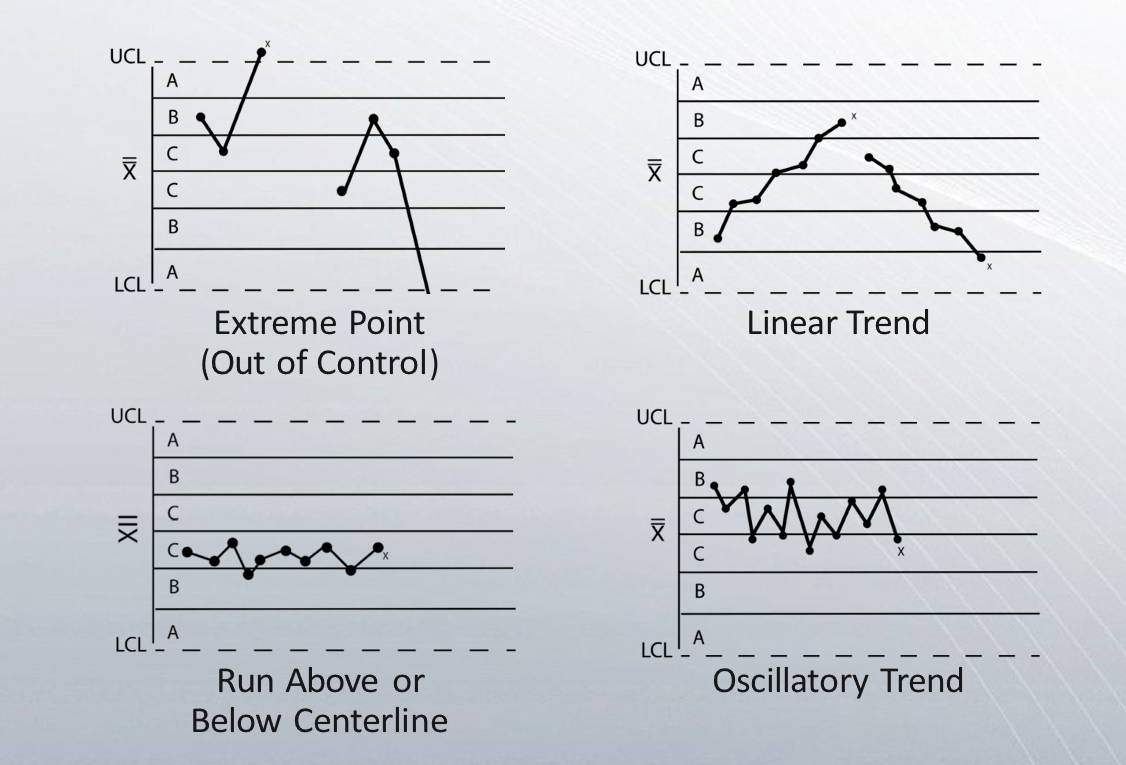
Full support of Western Electric and Nelson Tests for pattern recognition in control charts (e.g. extreme point, trend, stratification, oscillation, etc.) along with various alerts for each failed test.
Time Stamped Data
All observation data is marked with the data and time from the computer clock.
Corrective Plans
Operators choose corrective action as applied to the part or process. Multiple corrective actions can be applied to any subgroup. Empower operator to build on existing Corrective Action list.
Forced Assignable Cause
Force assignable cause tags on Inspector during collection if process is out of control. Empower operator to build on existing pick list.
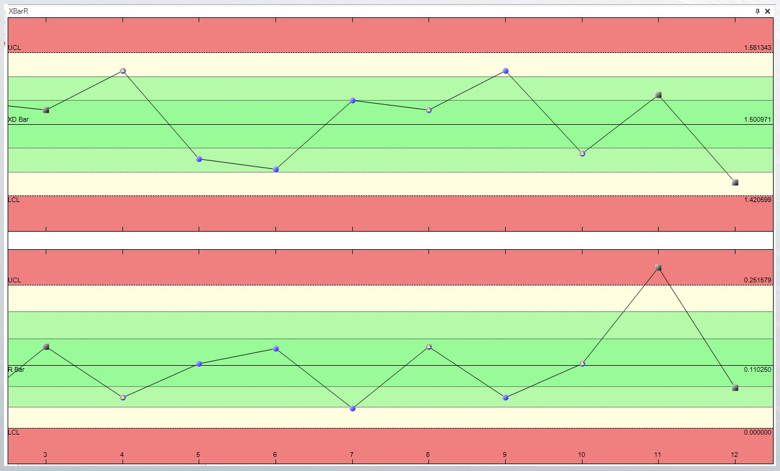
THE ADVANTAGES OF Control Charts
These charts are particularly helpful for machine dominant processes. The X-bar (mean) chart tells when a change has occurred in central tendency. This might be due to such factors as tool wear, a gradual increase in temperature, a new batch of material of greater toughness, or a different method by a night-shift workman. In looking for causes when an R (range) chart is out of control, look for poor repair or poor maintenance if this is a machine controlled process. Look for new operators or something disturbing the operators if this is an operator controlled process.
Real-Time Professional
MeasurLink® Real-Time Professional Edition enables customers to connect and acquire data from Mitutoyo Coordinate Measuring Machines, Vision and Form Measuring Systems via native integration (DDE).
In addition to all of the features supported by MeasurLink® Real-Time Standard Edition, this application also supports data filters. Full reporting functionality with templates is also provided. Supported data sources include keyboard, RS232 and USB devices, native Mitutoyo integration (DDE) ASCII, and QMD (xml-based) file import.
Additional Features & Benefits
Import Templates
Easily create an import template that maps data in a text file to MeasurLink information. Templates are saved to the database for everyone to use and can be added as data sources to data collection stations. An import template can be verified against the source file without adding data to the system.
Import Data
When set up as a data source, import templates are readily available to the operator, or periodic imports can be executed.
Data Transfer
Collect data into MeasurLink from Mitutoyo capital equipment running Mitutoyo Software that is MeasurLink enabled. This provides a tighter and more robust interface than importing data from files.
Data Filter
All data collected within a Real-Time run is related. Often, especially for runs containing a large volume of subgroups, requests are made for subsets of data that are further related from the entire run’s population. MeasurLink provides
AEROSPACE INDUSTRY
AS9100 CONFORMANCE
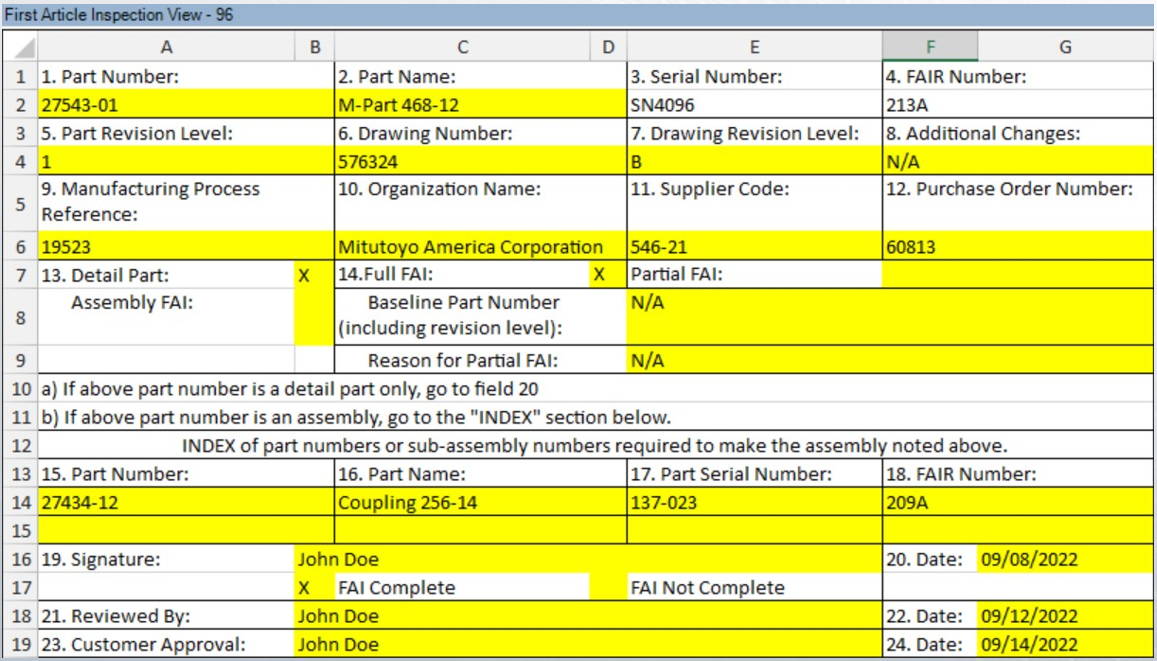
AS9100 requires a great focus on establishing and complying with design requirements. MeasurLink supports First article inspection view in Real-Time or Process Analyzer to provide a clear and concise approach for completing FAI reports that align with the AS9102 requirements. This feature includes forms 1, 2, and 3 with options to export to Excel or PDF and allows users to search first article inspection information and production data in one location.
Real-Time Professional 3D
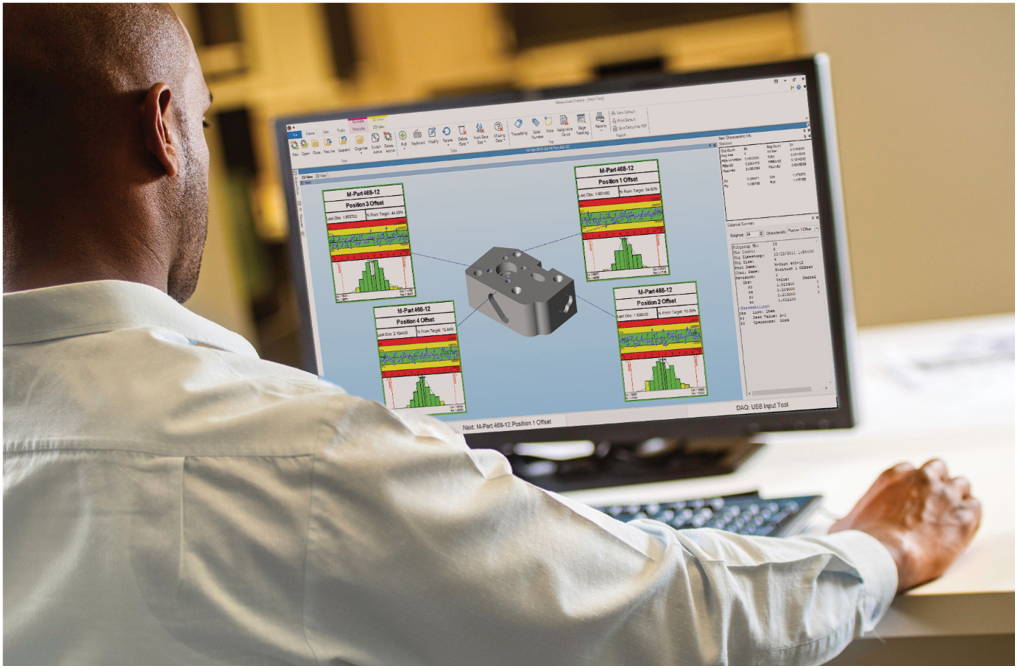
MeasurLink® Real-Time Professional 3D Edition is designed for customers who wish to collect data using the Hoops 3D graphics view, in addition to all features offered by MeasurLink® Real-Time Professional Edition.
Hoops 3D files can be exported from most CAD systems and provides the operator with a real view of the part. Camera angle and position can be saved for each characteristic providing for an intuitive, prompted, guided sequencing for the inspector. Supported data sources include keyboard, RS232, and USB devices, native Mitutoyo integration (DDE) ASCII and QMD (xml-based) file import.
Additional Features & Benefits
3D View
True three-dimensional model support with Hoops streaming files (*.HSF). Export your part’s model from Catia, Solidworks or other CAD software and place callouts in the 3D space.
Flexible Callout Design
Callouts provide part acceptability at a glance. You can design them the same way as the two dimensional view to include charts or statistical information with the ability to size any element inside the callout.
Guided Sequence
The display can automatically change during data collection to show the next or last observation point, providing a simple guided sequence for the inspection procedure. By saving a different view for each characteristic to be inspected, you can have the model rotate, pan or zoom to show the operator details of the part.
THE ADVANTAGES OF
OBSERVATIONS
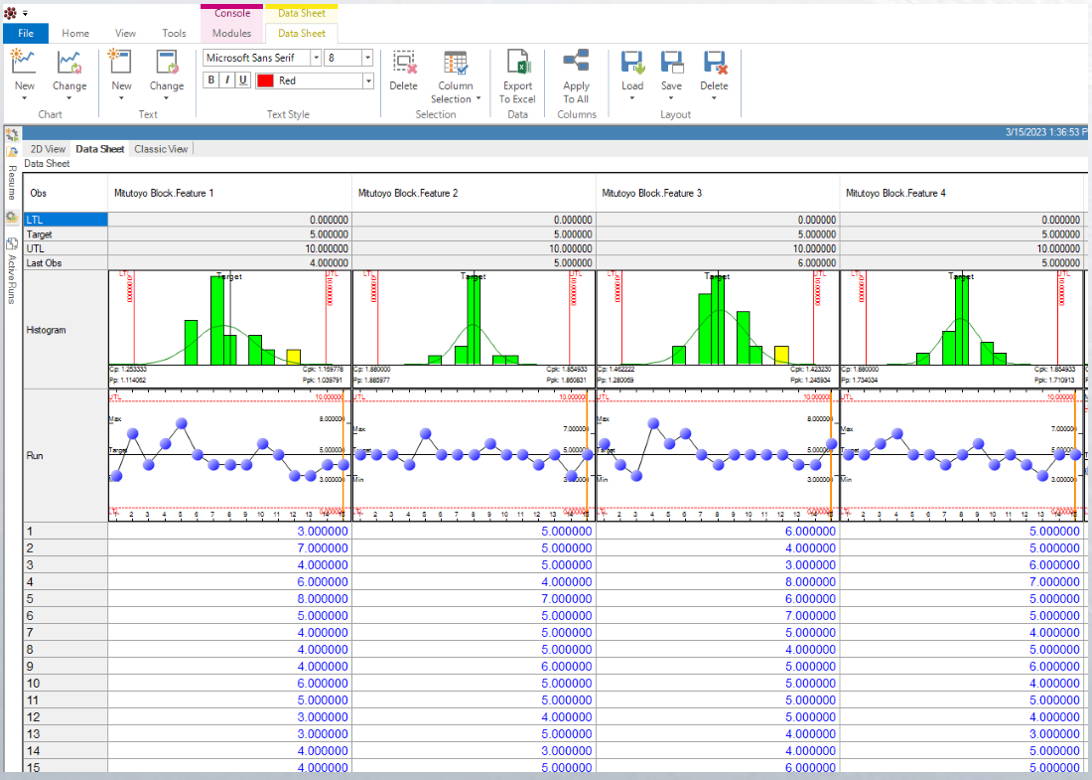
At the heart of any quality program is the collection of data. Whether through 100% inspection or a formal sampling plan, it is the observation data that drives all evaluations of conformance of "as manufactured" to "as designed" dimensions. Observation data drives the statistics, the control charts, the run charts, the histograms…everything.
Each observation measures one or more properties (such as size, location, weight, etc.) of observable characteristics distinguished as independent variables.
- The Observation Chart shows the actual data values, their data/time stamp, and the subgroup the data is in. The Data Sheet organizes the observations per characteristic. These windows provide the operator with easy editing (if allowed).
Process Analyzer Professional
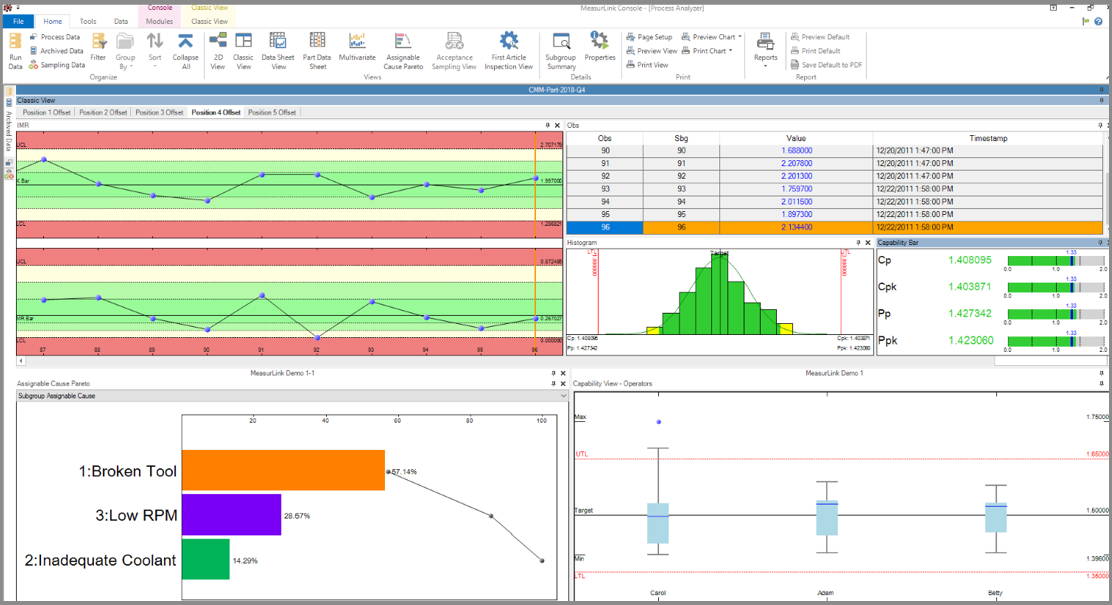
Analyze data collected on all networked Real-Time stations in one place to identify problem areas, take corrective action, and improve the quality of your product. Inspection data can be merged, filtered, charted and printed to identify long term trends and identify root causes for process improvement.
Process Analyzer Professional Edition is designed for viewing and manipulation of Real-Time data in a networked environment. It enables Quality Engineering to slice and dice data in meaningful ways that contribute to quality control initiatives.
fEATURES & BENEFITS
Review Inspection Data
Analyze inspection data, view notes and traceability. Open data from different runs to compare the data and process behavior.
Crystal Reports and Custom Reporting
Create your own customized Crystal Reports for use with Part or Run data. Build report templates with company logos and free form text. Select and position chart types to customer specification.
Advanced Filter
Easily filter for runs that meet your criteria. Choose your date range, Stations, Routines, failed data test, Traceability/Assignable Cause, Serial Number, note and more.
Merge Data
Combine lot based or just-in-time collected data to get a bigger picture of process variation and production quality. One option available for merging is to align data by serial number.
- Support FDA Requirements
- Summary Analysis
- Reporting
- Scatter Plots
- Filter Data
- Compare Capability to Traceability

AUTOMOTIVE INDUSTRY
Continuous Improvement
- Reduce scrap
- Prevent non-conformities
- Reduce cycle time
- Improve tool life accuracy
Process Manager Professional
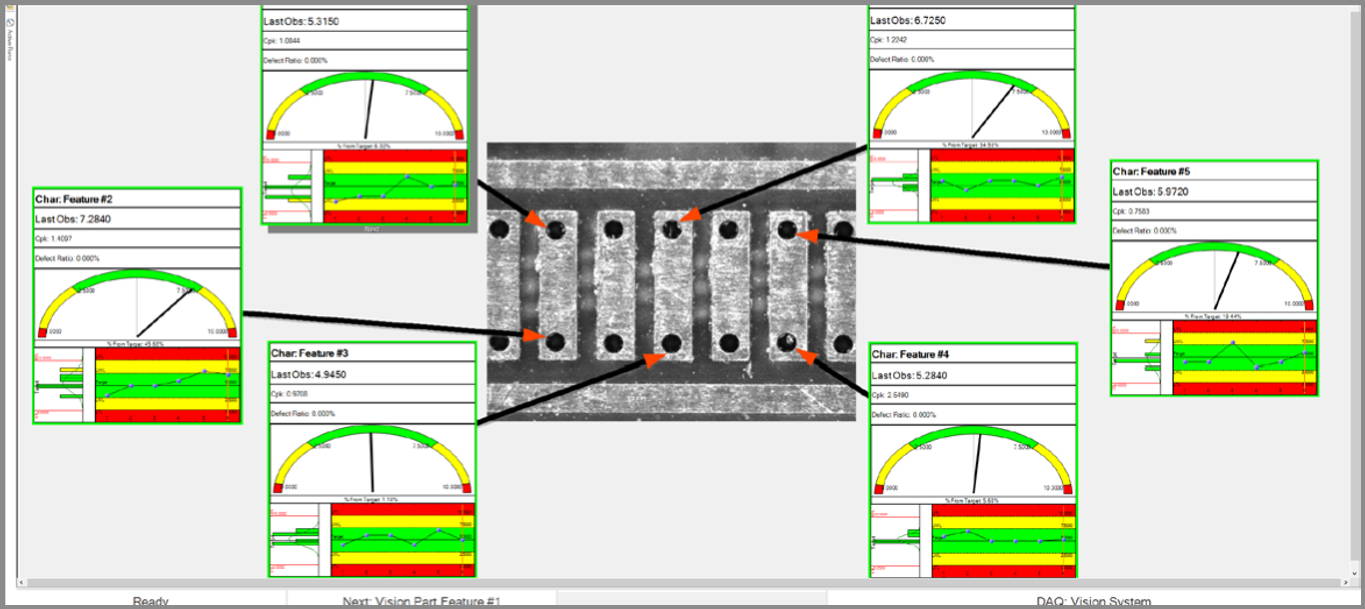
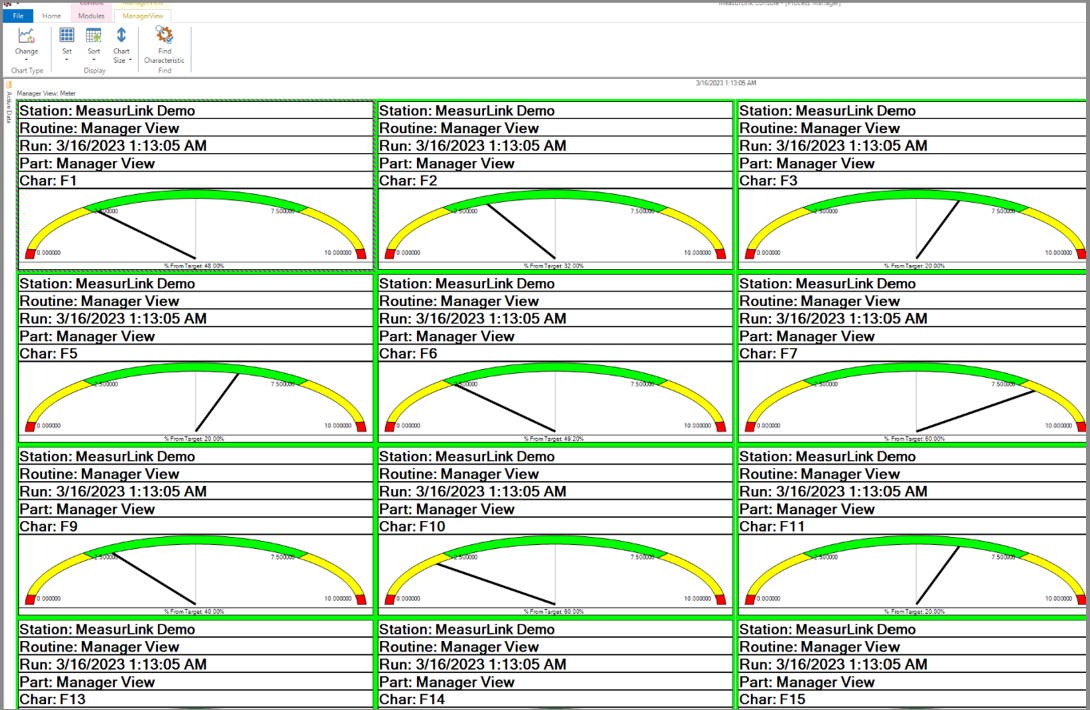
Monitor data as it is collected in Real-Time. Process Manager provides managers with the perfect tool to organize and maintain a shop-wide quality program at a glance. Display snapshot windows of characteristics that are currently being collected in MeasurLink® Real-Time. The data can be sorted by inspection station, capability or timestamp.
Easily see process information without walking from one inspection area to another by viewing current production across all machines. Show clients your quality operation for the entire facility.
Features & Benefits
Log View
Designed to display information from multiple Stations in a grid. The user can select the type of events to be monitored e.g. failed out of tolerance test.
Plant View
Allows users the highest level view of their shop floor processes. Callouts have a meaningful border color related to tests for capability that have been enabled in each routine’s properties. Add image of your floor plan.
Group and Search and Sort Data
View data by part, routine, station. Apply saved filters to data so you monitor only the data that you are responsible for. Supervisor can easily monitor the three stations in their cell.
THE ADVANTAGES OF
Statistical Data Tests
MeasurLink can check data, as it is received, for statistical patterns that indicate a change in randomness. A change in randomness can indicate that the manufacturing process has changed from its initial settings. The initial settings are designed to create the best Part possible, so when the system deviates from the initial settings operators and engineers can be alerted to bring the process back to optimum performance.
Gage R&R
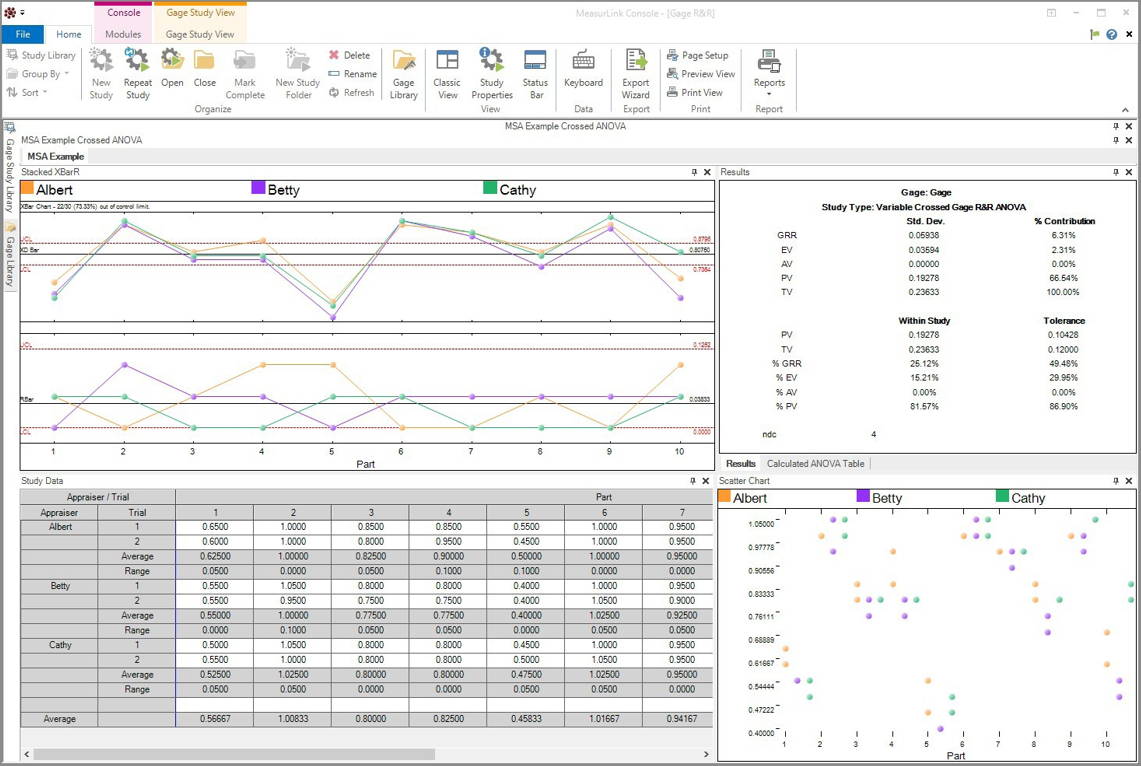
MeasurLink® Gage R&R is a collection of techniques whose purpose is to measure the capability of a measurement system for a measurement task.
Gage R&R results provide information about a measurement system’s reproducibility, repeatability, location or stability. Graphical tools allow for isolation of gaging problems including inconsistencies in technique between operators or inspectors.
Features & Benefits
Study Wizard
User guided study setup helps the user define the study that needs to be performed in order to determine the measurement system’s capabilities. All elements required for the selected study to be completed are captured before the study is created, and the user is warned to provide any missing information before beginning the study.
Direct Data Input
The data for the study can be collected directly from a gage connected to the system or transferred from Mitutoyo Coordinate Measuring Machines, Vision and Form Measuring Systems via native integration (DDE). Users can also key in their data.
Organization
All studies in the database are visible and can be organized using different criteria.
Randomized Collection Sequence
As recommended by the academic community, the collection sequence can be automatically

Traceability
Traceability is information about a part that is important, but not a measurement. This information can be collected and used as criteria for filtering the data.
Serial Number, Lot Number, Customer, Invoice, Order Fixture, Machine Line, Material type, etc.
MeasurLink has provided a wide array of traceability properties that can be customized to fully integrate the needs of the process. Assigning traceability gives the user expanded filtering and reporting options as well as the ability to provide greater granularity into root cause analysis.
Gage Management
Gage Management provides a method for maintaining, organizing and managing information about gages.
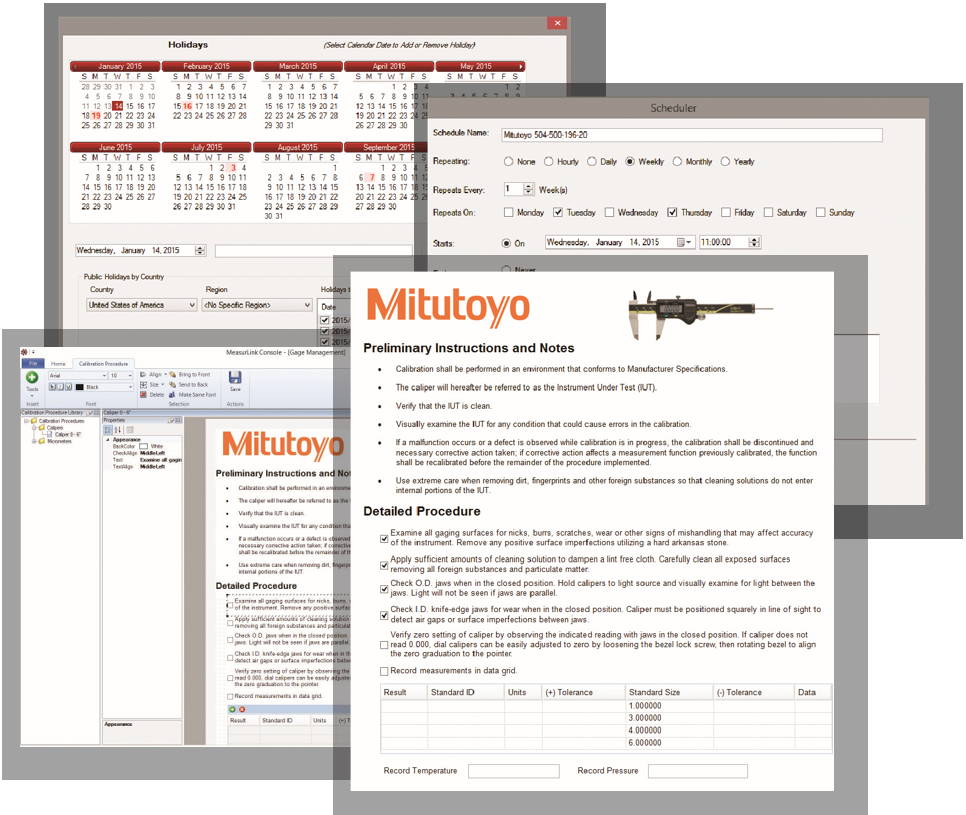
Information such as measurement specifications, calibration recall dates, Gage R&R dates and general event history is provided in an intuitive user interface with complete reporting abilities. Calibration procedure setup is easy and flexible.
Features & Benefits
Gage Inventory
Establish calibration standard and gage inventory. Build metrology asset database. Includes vendor, tolerance, range, owner, serial number, model number, etc.
Calibration Procedures
Generate calibration procedures with environmental conditions, instructions, gage block sequencing, etc.
Calibration Recall Reports
View calibration due date or overdue report to collect gages. Can be filtered based on various criteria.
R&R Recall Reports
View Gage R&R due date or overdue report to collect gages. Can be filtered based on various criteria.
the advantages of
Run Charts
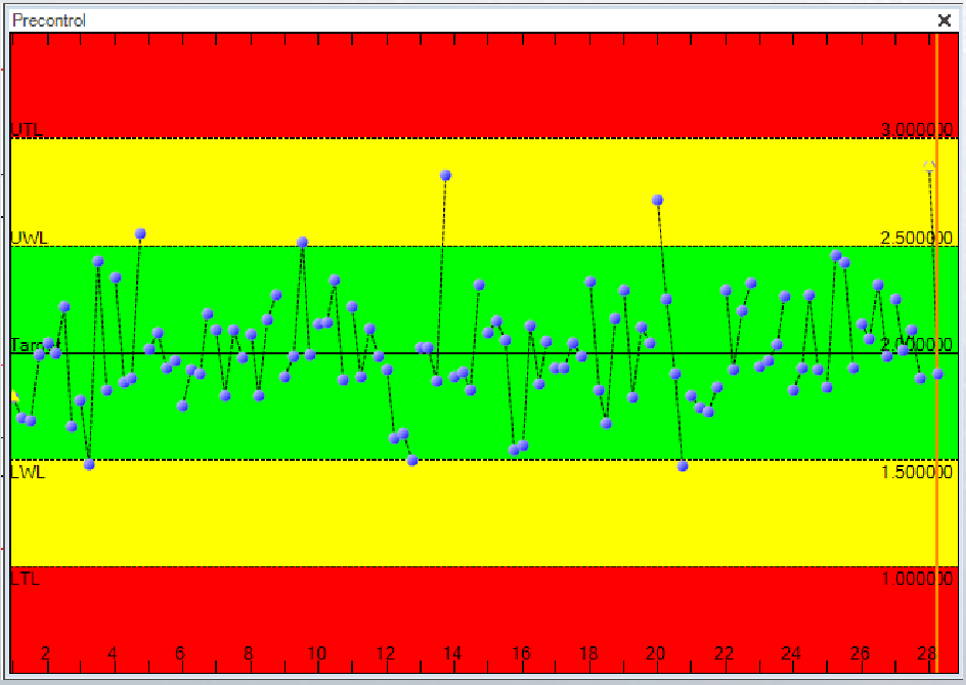
In many cases it is a good idea to start out by charting a process with this tool before applying a more powerful control chart. It will allow the user to remove inconsistencies that occur over time. A control chart might obscure some important information by averaging it out. The pre-control chart uses a technique known as “Stop Light Gaging” or “Zone Pre-Control”.
- The green zone prompts the user to continue the run (within tolerance state) with the acceptable observations that fall within this region.
- The yellow zone prompts the operator to use caution (near out of tolerance state) and look for possible problem causes.
- The red zone prompts the operator to stop the run (out of tolerance state) and determine the cause before starting the process again.
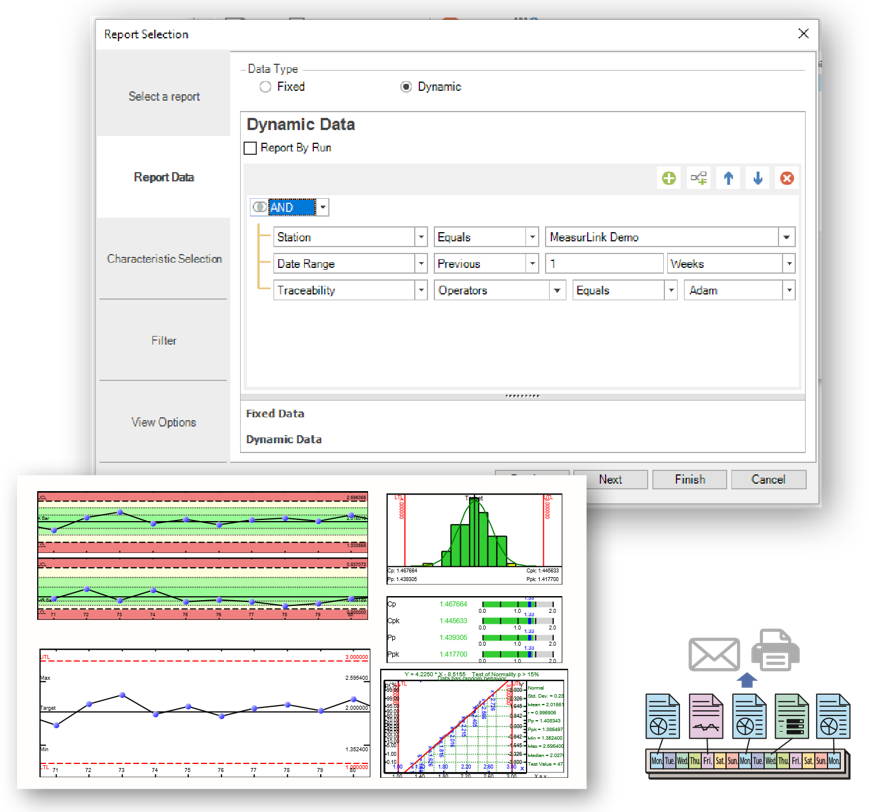
Report Scheduler
Report Scheduler is a tool that provides automated report distribution. A great time time-saver for engineers, create reporting tasks that will run on a given schedule.
The dynamic data reporting offers advanced filtering that can report on all data collected during a specified date range. A user can select which part numbers or batches they would like to report on before the measurement data exists. When the filter criteria is satisfied, users can receive a report with their analysis automatically, drastically saving them time from manually searching for and analyzing data.
For example, a user can schedule a report to run each weekend so Monday morning there will be a report on all runs added the previous week.
Features & benefits
- Ability to report on multiple runs across separate stations, parts, and routines based on filter criteria.
- Assign Reporting Schedule
- Choose Report Destination
- Supports Crystal Reports and MeasurLink Reports

MEDICAL INDUSTRY
FDA COMPLIANCE
FDA 12 CFR Part 11 applies to drug makers, medical device manufacturers, biotech and other FDA-regulated industries. It requires manufacturers implement controls including audits, system validations, audit trails, electronic signatures, and documentation for software and systems involved in processing the electronic data. MeasurLink implements strong support for these requirements.
Some of the tools used in FDA 21 CFR Part 11 Compliance are:
- Electronic signatures
- Audit trails
- Unique users and login credentials
- Support for software validation
Collection Scheduler
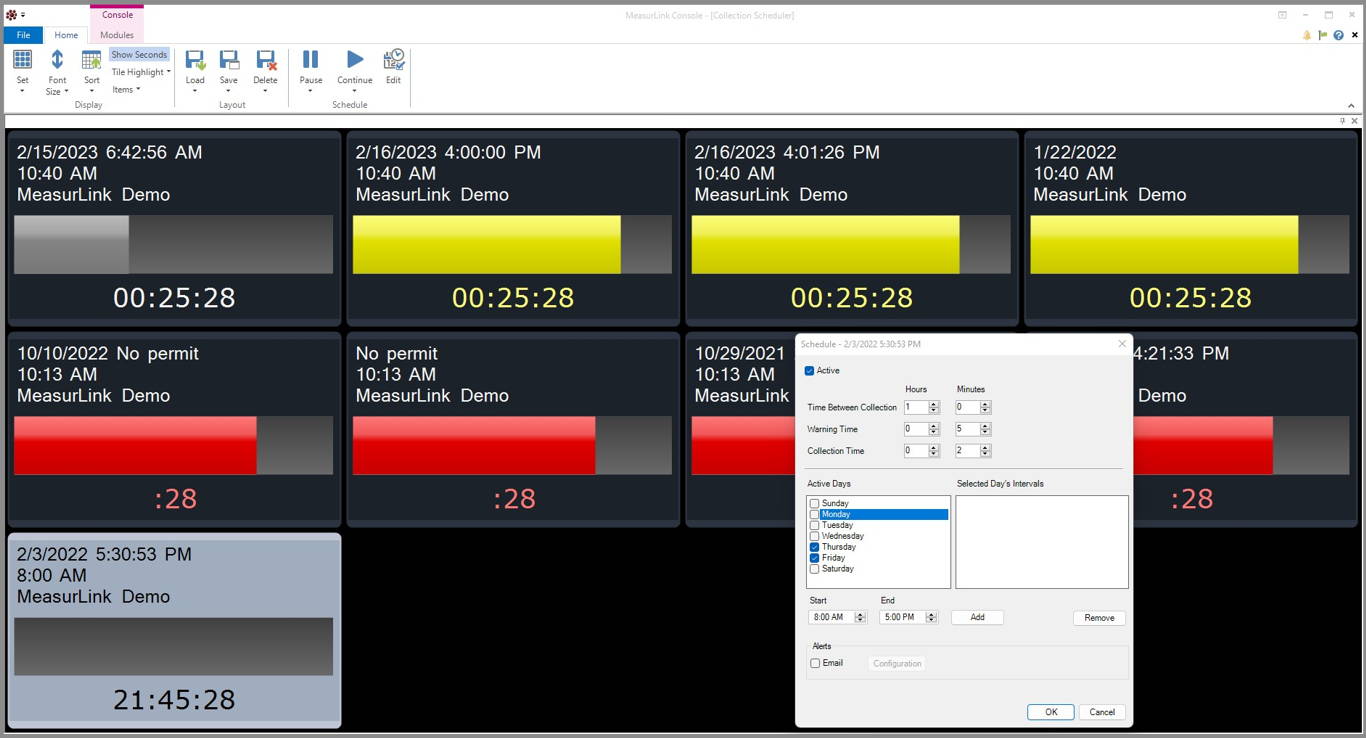
Keep critical measurements on track with MeasurLink Collection Scheduler. Designed for customers that manufacture and measure on a timed measurement schedule, Collection Scheduler works in conjunction with any Real-Time edition to alert operators when the next measurement is due with a colorful Andon display and timer. The perfect tool to keep measurements on-time for operators running multiple machines or jobs, the Collection Scheduler timer will reset as soon as measurements have been taken in Real-Time.
Supervisors can receive email alerts when measurements miss their assigned schedule or simply keep an eye on the entire shop-floor schedule using Process Manager’s new Collection Scheduler view.
Features & Benefits
Colorful Andon Display
Run tiles turn red or yellow if schedules are due or about to be due to help operators easily recognize when measurements need to occur.
Customized Schedules
Set schedules for each day or shift to suit organizational needs.
Auto-switch between modules
Select the run due for measurement and automatically launch it in Real-Time. Suspend the run and automatically return to Collection Scheduler for easy operation.
Customizable Layout
Set the size and layout of the run tiles to make easy identification when managing multiple runs.
SECURITY CENTER
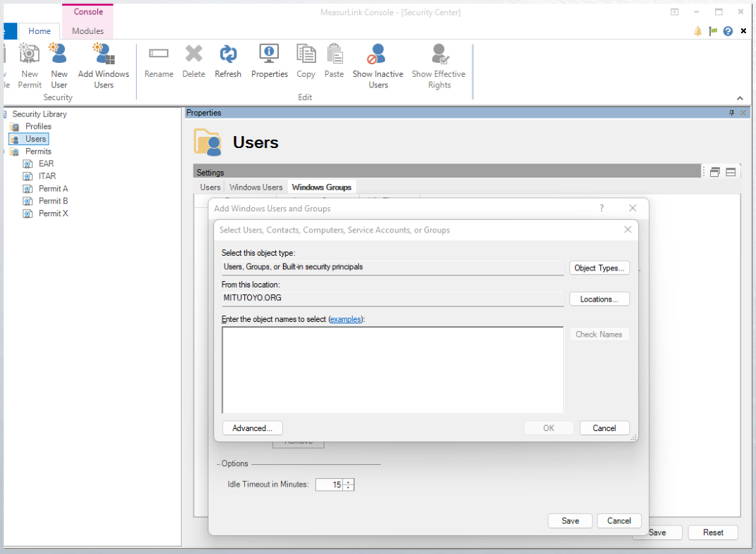
Security Center will help manage the internal user community within the MeasurLink system. This module provides a simple and efficient method to manage user permissions.
Windows Active Directory Support
Support for Windows users and groups is available and with single sign-on capabilities, an authorized user will have the proper rights just by logging in to the computer and launching MeasurLink.
PERMITS
Control access to sensitive part information at a user or windows user level.
Product Licensing
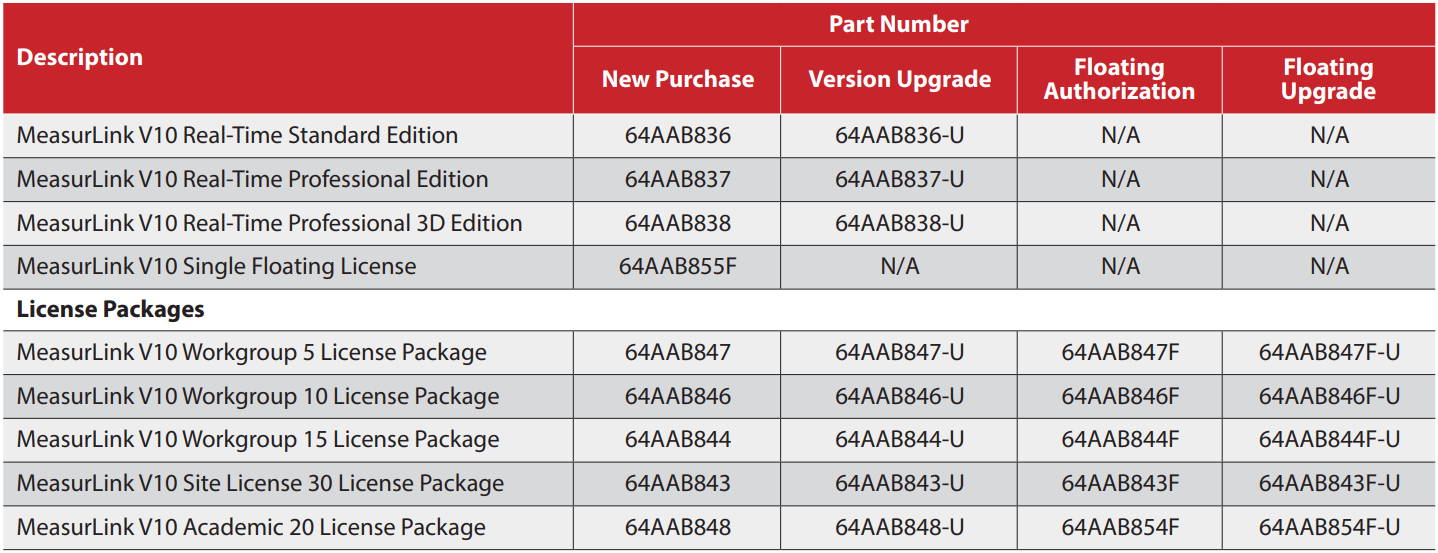
Mitutoyo is pleased to offer MeasurLink without the need to purchase annual maintenance agreements. Mitutoyo offers different licensing options to support a variety of needs. Start small, go big, or anywhere in between!
Workgroups are discounted packages for multi-license purchases.
Licensing Options
Workgroup License
Mix and match any licensed module to form a bundled package for increased flexibility and reduced cost-of-ownership. Workgroups come in packages of 5, 10, 15 and 30. (Real-Time Professional 3D is not included).
Single Floating License
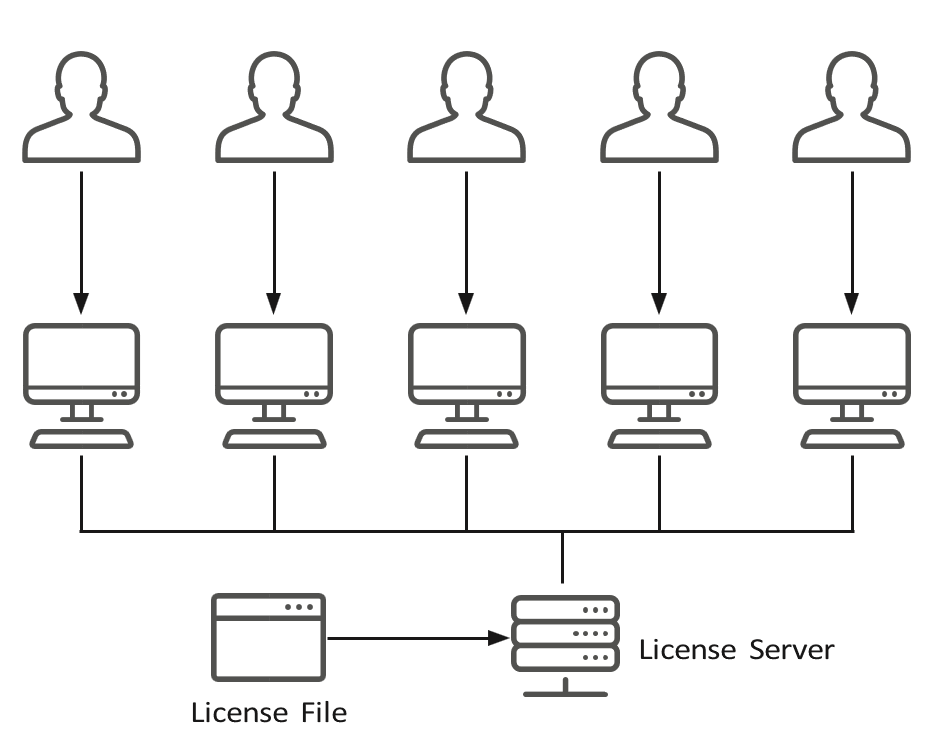
A single-floating license, no add-on required. Use any module and share with anyone on the network.
Standalone License
Any Real-Time Edition can be used on a single station to test a pilot cell, solve a specific application or monitor a critical line. The Gage R&R module can be used on a standalone station to perform Gage R&R tests. Track gage inventory and calibration schedules with the Gage Management module.
Academic License
Mitutoyo is committed to Research and Development and Workforce Training and promotes the use of MeasurLink® in Research and Educational institutions with discounted packages.
Floating License Authorization
For network licensing, add the floating license authorization to a workgroup. The number of licenses purchased can be shared with anyone on the network and can use any and all modules (RTP-3D is not included). Floating license authorization is required for cloud or terminal server environments.
*Support Center and Security Center are included with any license purchase

PLASTICS INDUSTRY
ANALYSIS OF MEASUREMENT DATA
Measurement data is only useful if it can be found when it is needed. Manufacturers need instant access to data regardless of when or where it was measured. MeasurLink Process Analyzer meets the analytical and reporting needs of manufacturers.
- Filter fata by traceability items
- Merge data from other Lots of processes
- Generate reports on current or historical data
- Summary reports allow complex review of large amounts of data
- Multivariate charting allows analysis of correlation
- Access data from any workstation in system, across the room or anywhere on your network.
MeasurLink® 10
THE ADVANTAGES OF
Histograms
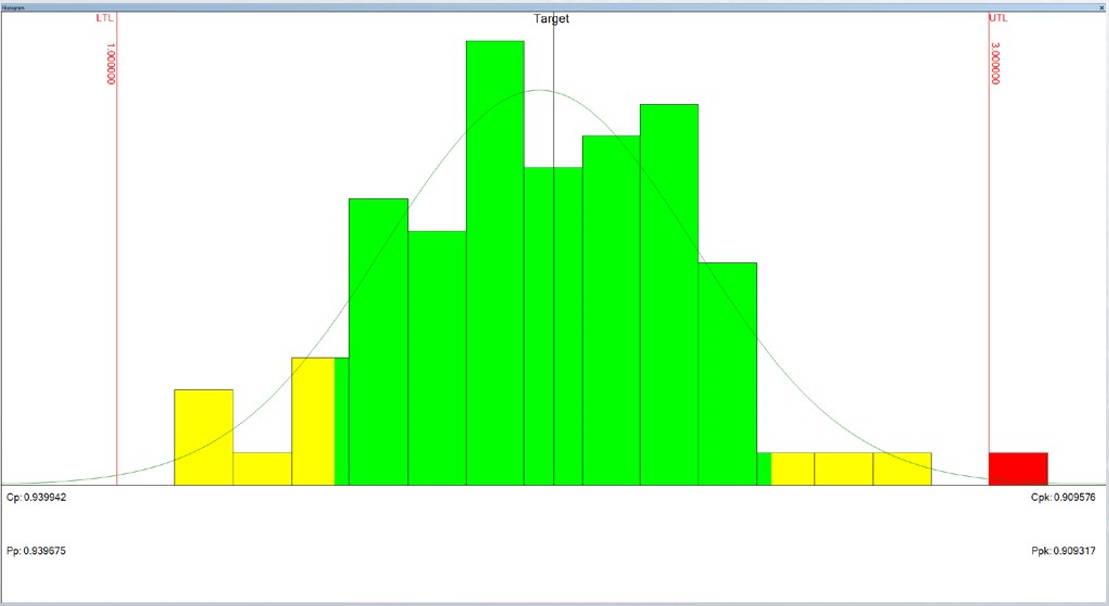
The histogram is not a chart, it is a frequency distribution. The histogram is the most popular frequency distribution method in use today.
Coupled with specification limits, it can tell the operator a lot about a process. The histogram gets its name from the fact that it displays historical information. The frequency distribution is plotted as side by side columns, each having equal width.
The frequency histogram is a very effective graphical and easily interpreted method for summarizing the collected data and shows the dispersion of the process. It provides information about: the average (mean) of the data, the variation present in the data, the pattern of variation and whether the process is within specifications.
Database Management System (DBMS) Requirements
MeasurLink® 10 ships with Microsoft® SQL Server Express Edition 2019. This edition can be used to support a standalone or multi-machine workgroup installation. We recommend 5 licenses or fewer when using SQL Server Express).
MeasurLink® supports the following Microsoft® SQL Server versions:
- Microsoft® SQL Server 2022 Standard Edition
- Microsoft® SQL Server 2017 Standard Edition
- Microsoft® SQL Server 2022 Enterprise Edition
- Microsoft® SQL Server 2017 Enterprise Edition
- Microsoft® SQL Server 2019 Standard Edition
- Microsoft® SQL Server 2016 Standard Edition
- Microsoft® SQL Server 2019 Enterprise Edition
- Microsoft® SQL Server 2016 Enterprise Edition
Operating System Requirements
All MeasurLink® 10 products are supported on the following Microsoft® Windows Operating System versions:
- All Windows® 10 versions (not including Mobile and IoT versions)
- All Windows® 11 versions (not including IoT versions)
- 64-bit operating systems required
Hardware Requirements
These requirements are the minimum for the Windows® OS and may not provide optimum performance. In general, the more powerful the PC, the faster the response times!
To shop our Mitutoyo Measurlink SPC Software Selection, Click Here.
