
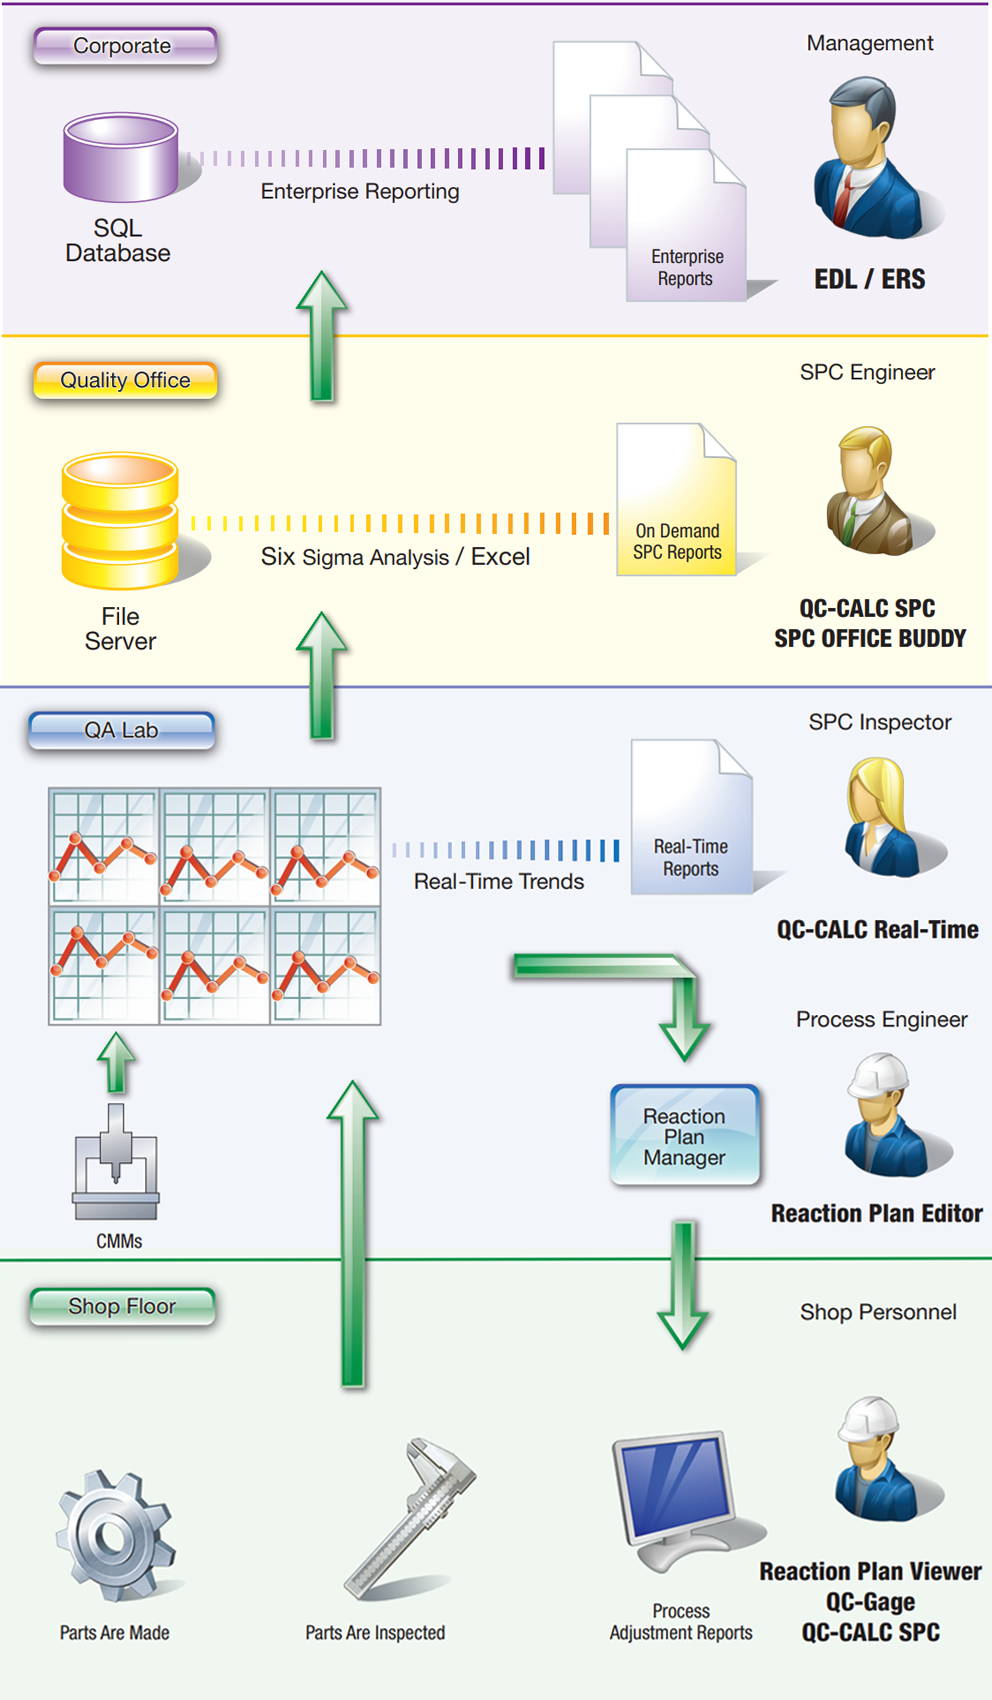
Prolink offers an entire suite of software solutions to address and automate the data collection and quality analysis tasks performed throughout your organization. As depicted below, the collected data can then be shared at each level of your organization using our various software tools. The diagram and brief summary explains how
each program fits into the big picture. Each color-coded level in the diagram has a corresponding colored data sheet providing the detail and key benefits of the product described.
Shop now for ALL QC-CALC software.
Enterprise Report Scheduler™ - ERS
The Enterprise Report Scheduler provides high-level summary reporting at the factory or corporate level. Reports can be scheduled at regular intervals to compare the quality capability across departments, plants, and multiple locations.
QC-CALC® SPC
QC-CALC SPC is our comprehensive statistical process control application designed to monitor, manage, analyze, and report the results of your inspection data right from your desktop.
SPC Office Buddy™
Although QC-CALC SPC is our main QA analysis tool, the SPC Office Buddy provides a fast and easy method of moving your data directly into Minitab®, JMP®, and Excel. Integrating with external programs allows employees to leverage existing software purchases and streamlines acceptance within your organization.
QC-CALC® Real-Time
Written in 1983, QC-CALC Real-Time is at the heart of Prolink’s software suite since it is the central hub of all data collection. This standalone program is required by most companies since it collects, analyzes, and reports the inspection results.
Reaction Plan Manager™ (RPM)
This ground breaking software package provides productivity tools beyond SPC. It allows you to combine measurement data with engineering knowledge to produce very specific operator instructions used for machine adjustments.
QC-Gage®
QC-Gage is designed to collect inspection
data directly from electronic gages or operator typed values.
QC-CALC REAL-TIME
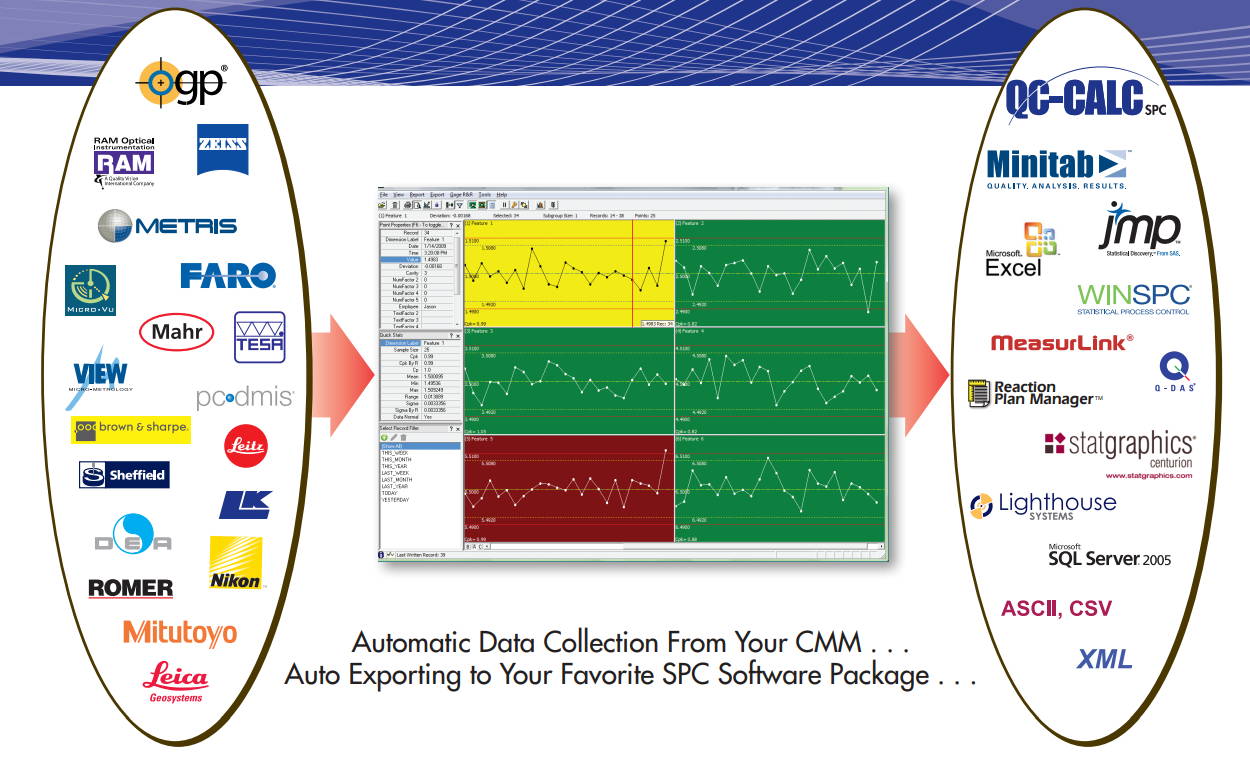
QC-CALC Real-Time is used to collect and display measurement results from all CMMs, Vision Systems, and any computer driven inspection device. You can create reports and export data to spreadsheets, databases, and other SPC programs. This means you can transfer data from all of your measurement devices to one SPC package!
The seamless integration with automated gages is the cornerstone of QC-CALC Real-Time. Prolink's relationships with the equipment suppliers enable them to understand how their gage operates and to automate reading its output. Prolink has eliminated any effort on your part to read the data directly into QC-CALC so you have absolutely nothing to do but watch the graphs plot.
Shop Now for QC-CALC Real-Time SPC Software.

Pre-Control
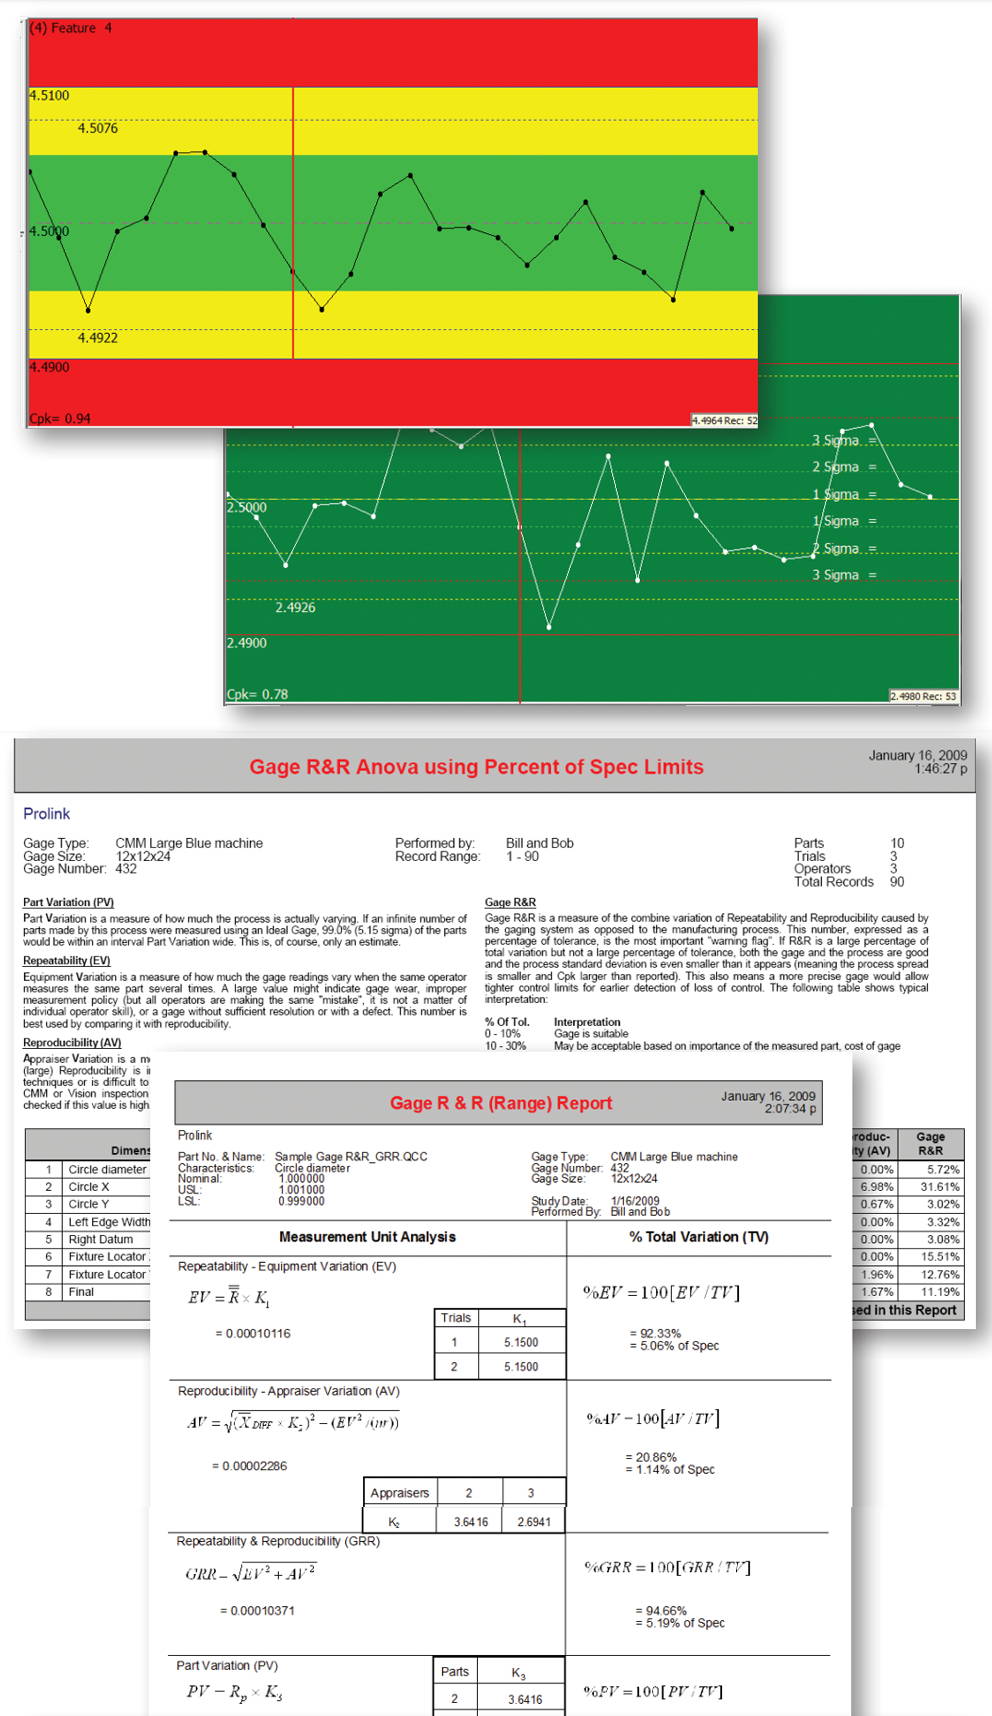
Pre-control is a technique that is used to detect shifts or upsets in the process that may result in the production of nonconforming units. The three pre-control zones are set at fixed percentages of the Tolerance.
Sigma Lines
1, 2, and 3 Sigma zones can be represented on the Plots by either lines or colored areas.
Gage R&R Wizard
Inspection data is useless without first proving the reliability of the measurement system on which it is collected. A Gage
Repeatability and Reproducibility (GR&R) study doesn’t have to be a painful process. With our Gage R&R Wizard, we help you
set up the study, guide you through it, warn you of potential problems, and help you analyze the results.
With QC-CALC’s guidance, you never need to worry about all of the combinations of Part, Trial, and Operator numbers. The next part for you to measure is clearly displayed at the bottom of the Real-Time screen, and QC-CALC takes care of the rest.
As you perform the study QC-CALC provides you with an estimated GR&R value that is updated throughout the study. This allows you to save time and money by stopping a study when one or more features are having a serious problem.
Analyze the Results
QC-CALC includes a set of concise reports that allow you to quickly locate problem features. You can also flag any GR&R
values that are over a certain percentage in red.
Introduction
QC-CALC Real-Time is used to collect and display measurement
results from all CMMs, Video CMMs, and hand gages without
operator intervention. You can create reports and export data to
spreadsheets, databases, and other SPC programs. This means
you can transfer data from all of your measurement devices to
any SPC package using one program!
This is the first program to provide one interface for all machines
and one interface for all outputs. Our goal is to make your data
collection seamless no matter what equipment you’ve purchased
or software you use.
- Fully automatic data collection from over 150 types
- of machines.
- Visually see up to 1200 live plots (dimensions) while
- collecting data for thousands
- One common interface for all gages
- Manual and automatic export capability to over
- 20 different SPC formats.
- Email reports automatically
- Manual and automatic exporting
- 21 CFR Part 11
- Trend detection with email alerts
- Dynamic filtering of parts
How it Works
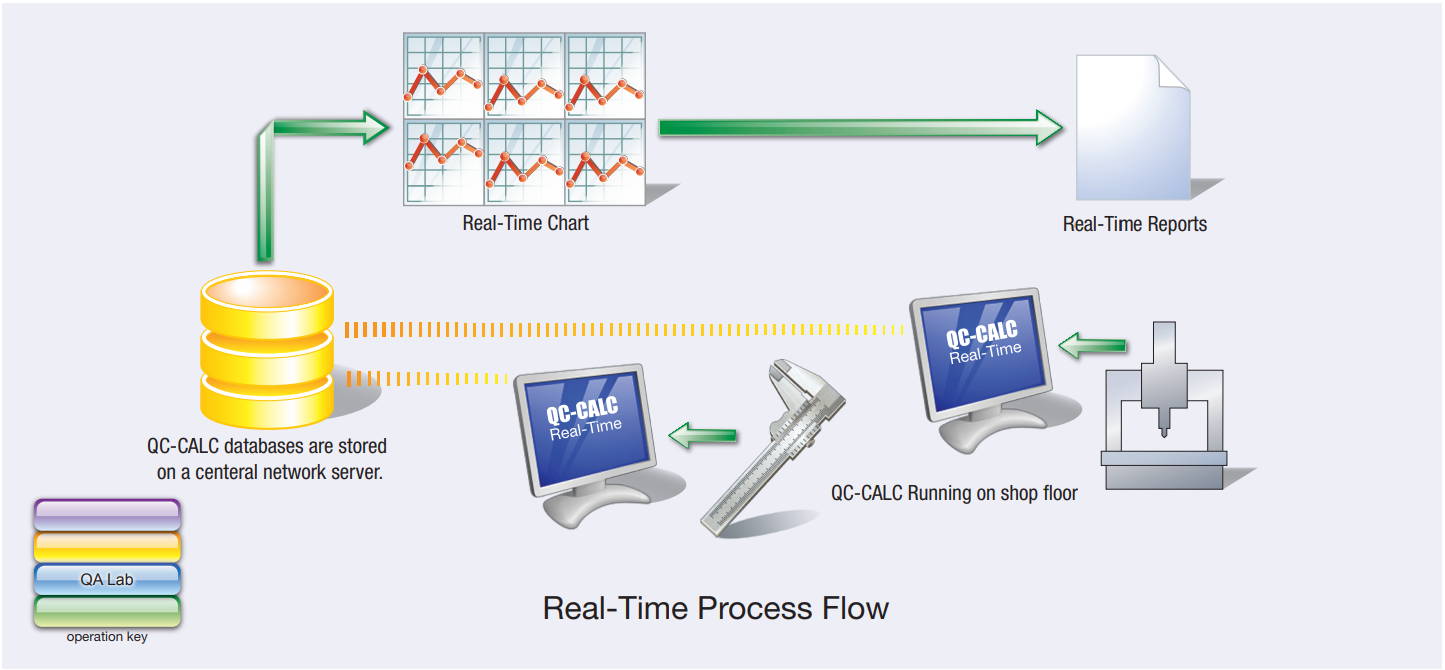
The seamless integration with automated gages is the
cornerstone of QC-CALC Real-Time. Our relationships with the
equipment suppliers enable us to understand how their gage
operates and to automate reading its output. We eliminated any
effort on your part to read the data directly into QC-CALC so you
have absolutely nothing to do but watch the graphs plot. Please
read the features presented in this fact sheet to gain a better
understanding of QC-CALC’s capabilities.
REPORTING
QC-CALC Real-Time reporting allows you to print the following reports manually or automatically without operator intervention:
• First Article – 1 Piece
• First Article – 5 Piece
• Raw Data
• Stat Summary
• Plot Report
• Visual Part Report
• Single-Part Gage Report P/T Ratio
• Multi-Part Gage Report P/T Ratio
• Full Gage R&R (ANOVA or
Range method)
• Gage R&R Single sheet MSA
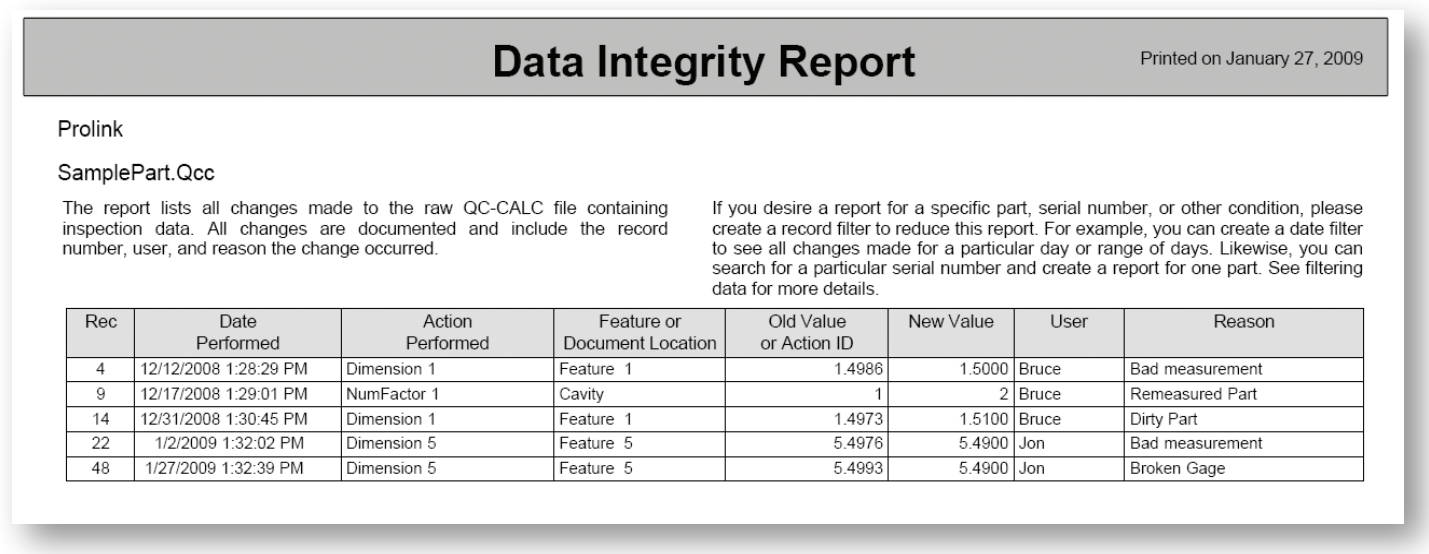
• 21 CFR Part 11 Audit Report
Report Formats
The Real-Time and SPC Reports can be printed to the file formats listed below. You can also manually or automatically attach your reports to an email message and let QC-CALC notify when your process goes out of control or tolerance, or below configurable limits. QC-CALC uses MAPI, Prolink’s SMTP Server, or your companies SMTP Server.
- PDF (signed electronic)
- Rich Text Format (RTF)
- Excel
- Excel Table
- XML
- HTML
- Metafile (EMF) Enhanced
- MIME HTML
- Multi-MIME HTML
- Bitmap (BMP)
- TIFF
- Text
Record Filtering
Real-Time record filtering allows you to quickly show and report on just the data you need at the moment. Dynamic filtering allows you to change the displayed values based on the part just received.
Dimension Filtering
Create and save different combinations of dimension filters to quickly choose between the different filters. This provides a rapid view of critical features you care about.
Pinpoint On-Screen Information
Each plot contains many points and each point has many properties. With the click of a button, point and plot information
is available in a panel on the left side of the screen. View the Quick Stats panel when you click the calculator button. Highlight a group of points and see the live calculations update.
Trend Analysis
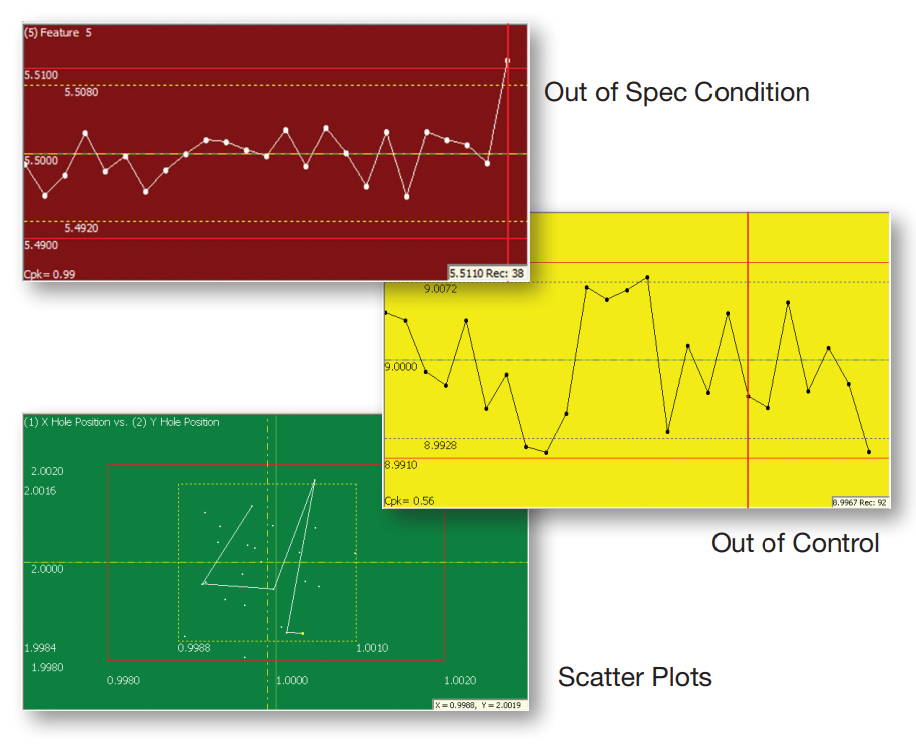
Use any of the Trend Analysis tests below to monitor your process and automatically trigger a report or log file. Optionally force operators to assign causes and corrective action, or simply display the trend on the plot.
- Drift Trend
- Stratification
- Mixtures
- Instability Tests
- Point Outside 3 Sigma
- Control limit violation
- Spec limit violation
- Cp, Cpk Exceptions
Trends are depicted as thick lines superimposed on the plots, with background color change.
21 CFR Part 11
The control of inspection information as it applies to the medical industry is defined by FDA title 21 Code of Federal Regulations
(21 CFR Part 11). QC-CALC’s data collection, storage, and reporting adhere to this important standard. This option has had an increase in use by industries other than medical, but this option can be disabled for industries not requiring such strict control.
Exporting
QC-CALC Real-Time exporting allows you to export data manually or automatically. The following formats are supported:
- DataPage
- InfinityQS
- IQS
- JMP
- Q-DAS
- Lighthouse
- MeasurLink
- Minitab
- QMC CM4D
- Proficy Shop Floor
- Statgraphics Centurion XV
- Visual SPC
- WinSPC
- Access
- QMD Class 1, 2, & 3
- Oracle
- Reaction Plan Manager
- SQL Server
- XML
- Excel
- Lotus 123
Assignable Causes/Corrective Actions
Indicate assignable cause variance by right-clicking on the plots and assigning a cause to your parts.
Trace Fields
Extra non-measurement data values are automatically addedfrom the inspection machine and available for live filtering.
qc-calc spc

QC-CALC SPC CHARTING SOFTWARE
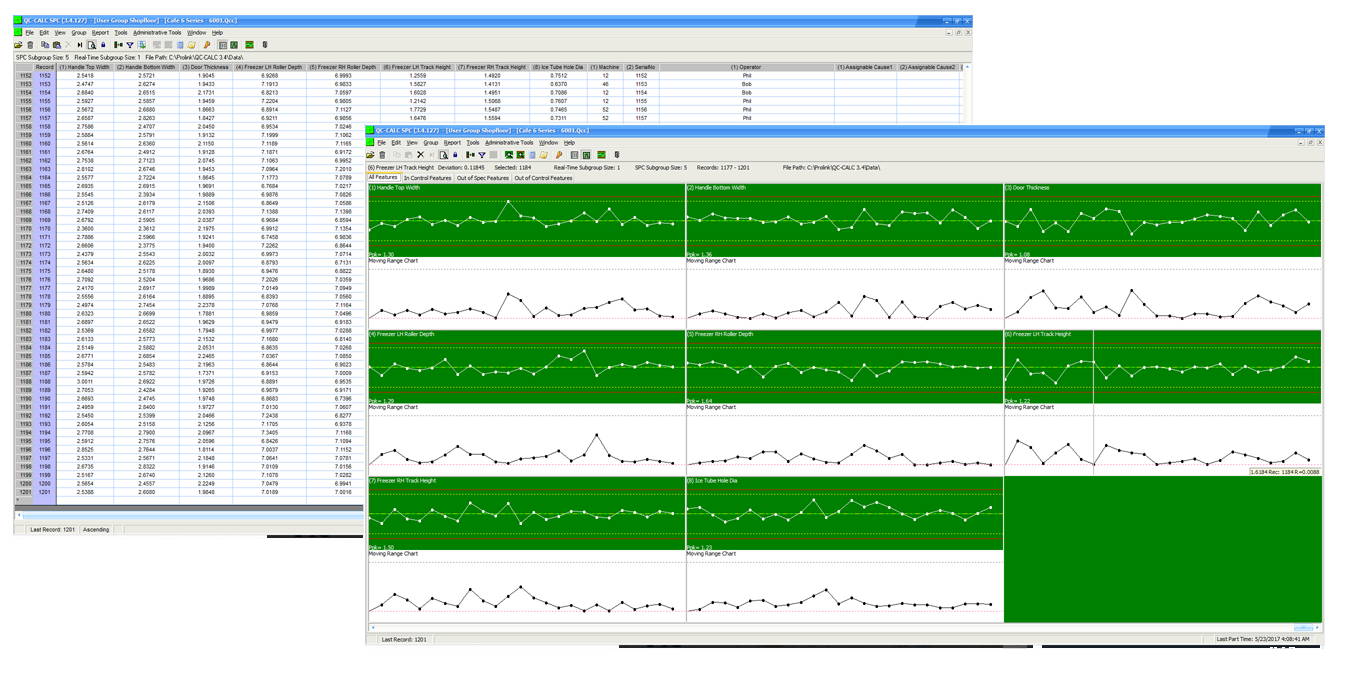
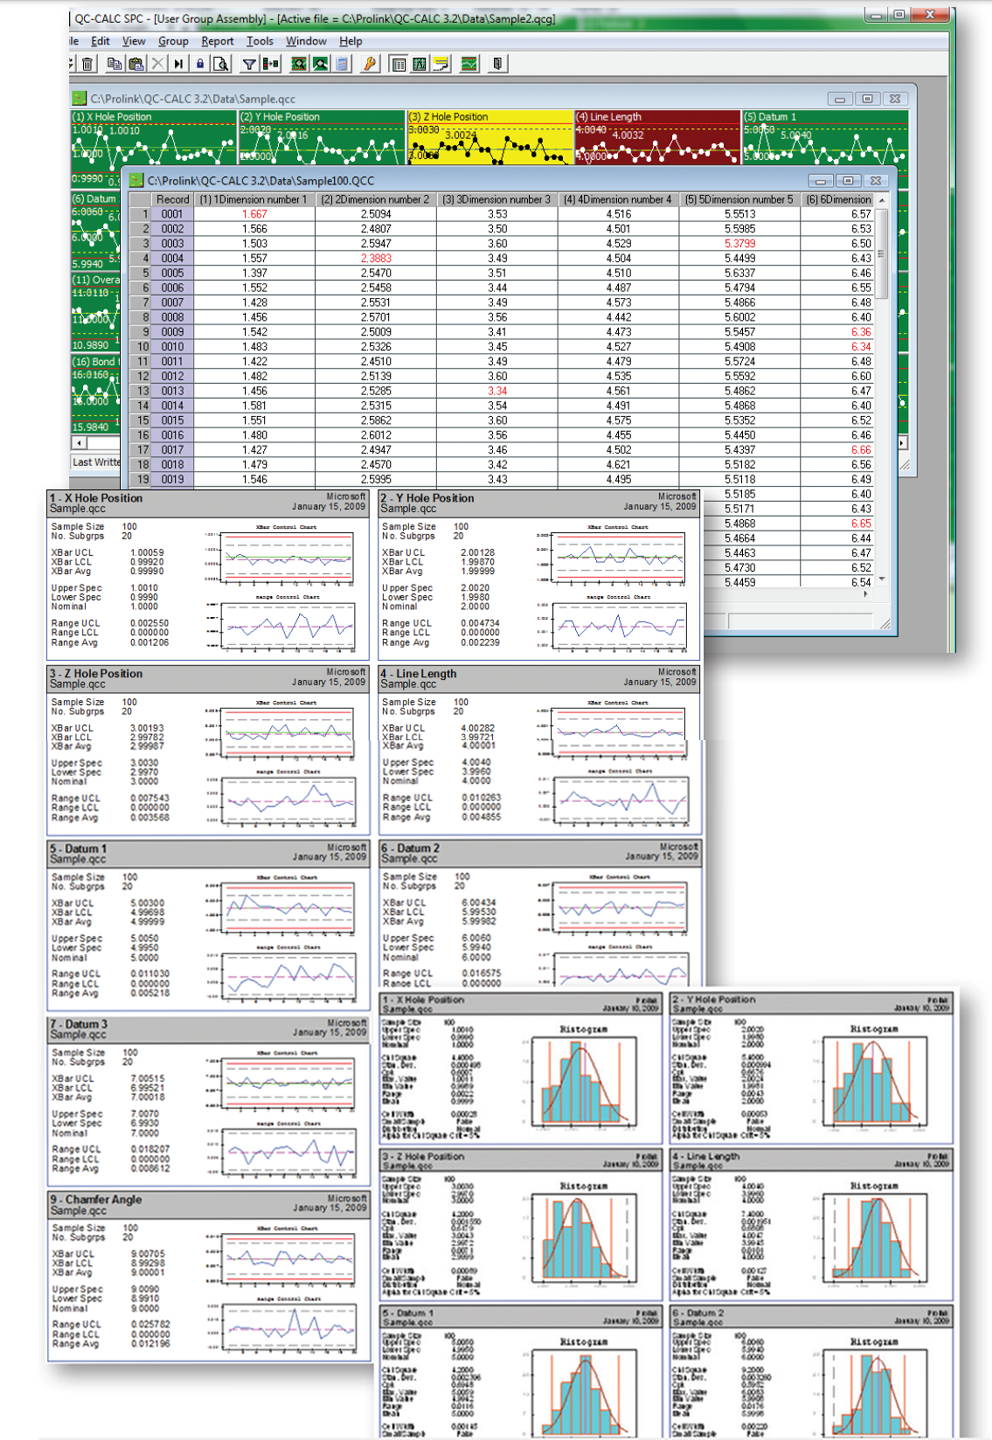
QC-CALC SPC is a complete SPC charting software package that analyzes the data collected by QC-CALC Real-Time. QC-CALC SPC’s chart software generates charts and reports to constantly monitor your process and keep it in control.
QC-CALC SPC offers a wide variety of charts and functions to aid your analysis and give you the power to make on-the-spot decisions. In seconds, QC-CALC SPC gives you a precise picture of how your production line is performing with easy-to-use menus.
Group data from multiple sources and SPC databases, filter it, monitor the shop floor, and run charts with a couple clicks with our qc reporting software.
Shop Now for QC-CALC SPC Software.
KEY BENEFITS
- Process capability charts
- Attribute charts
- Ability to print reports direct to PDF
- Ability to email reports
- 21 CFR Part 11 compliant
- Remote Real-Time monitoring capability
- Multiple database grouping
- capability
- Built-in report designer
- Built-in password protection

HOW IT WORKS
QC-CALC Real-Time reads CMM and gage data and saves it to the network database making the results available to QC-CALC SPC. QC-CALC SPC opens the same database from your office or other remote location. As data is collected, your SPC plots are continuously updated to show you live results from the shop floor. QC-CALC SPC can then filter the data and run charts and reports giving you full control.
Reporting
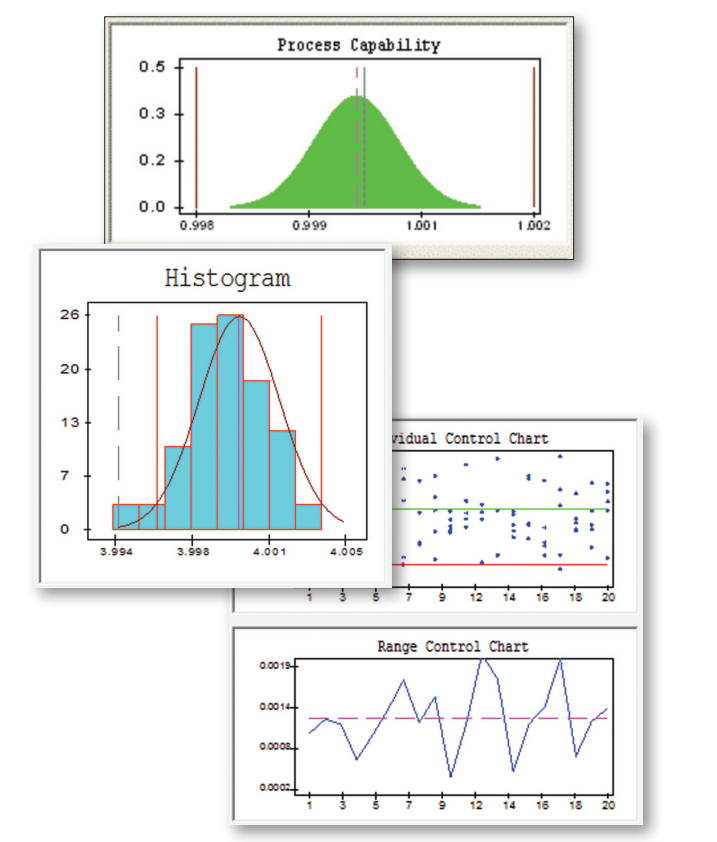
Reporting in QC-CALC SPC allows you to analyze the data and print your charts to a printer, print preview, or to a file. The following report types are available:
- Xbar & Range
- Xbar & Sigma
- Median & Range
- Individual & Range
- Process Capability (Cpk)
- Probability Plot
- Pareto Analysis
- P Chart
- C Chart
- Np Chart
- U Chart
- Individual & Moving Range
- Moving Avg. & Range
- Bivariate Analysis Report
- Correlation & Regression
- Raw Data w/Outlier Detect
- Histogram Analysis
- Statistical Summary
- Non-Conformance
- Raw Data
- Gage R&R (Range and ANOVA)
- First Article
- 21 CFR Part 11 Audit Report
Report Formats
The Real-Time and SPC Reports can be printed to the following file formats:
database maintenance
The basic database maintenance functions included with the software are:
- PDF (signed electronic)
- Rich Text Format (RTF)
- Excel
- Excel Table
- XML
- HTML
- Metafile (EMF) Enhanced
- MIME HTML
- Multi-MIME HTML
- Bitmap (BMP)
- JPEG
- TIFF
- Text
- Merge
- Purge
- Compact (Removes deleted records)
- Restructuring the database
Dimension Filtering
Dimension filtering allows you to create and save different combinations of dimension filters providing a quick view of critical features. Dynamic dimension filtering allows you to see only features that are trending, out of specification, or out of control.
Trace Fields
Extra non-measurement data values are automatically added from the inspection machine and available for live filtering.
Record Filtering
Record filtering allows you to quickly show and report on just the data you need at the moment. Dynamic filtering allows the
displayed values to change automatically based on the part just received.
Grouping
If you’ve ever inspected parts using CMMs, Video CMMs, or hand gages, you understand the problems associated with
creating a concise summary report from multiple data sources. Grouping allows you to open multiple files at the same time to create a full report across inspection equipment. Each file can be displayed in a grid or as plots similar to QC-CALC Real-Time.
21 CFR Part 11 Compliant
The features that make QC-CALC so flexible can be controlled using the built-in Administrative Tool to guarantee total control of changes. This system includes an audit report showing all password protected changes.
SPC OFFICE BUDDY
The SPC Office Buddy is a revolutionary new data reporting software that integrates directly with Minitab, JMP, and MS Excel to run reports using CMM data collected by QC-CALC Real-Time. This direct integration virtually ends manual data entry once and for all. The Buddy allows you to set up custom filters to reduce your data before sending. When finished, you can run statistical reports or Sixpacks on any subset of your data and then place these charts into your Excel reports in the location of your choice. The Buddy automatically sends each feature’s label, nominal, tolerance, and subgroup information straight to Prolink Charting, Minitab, or JMP without typing, saving you time and money.
Shop Now for SPC OFFICE Buddy.
HOW IT WORKS
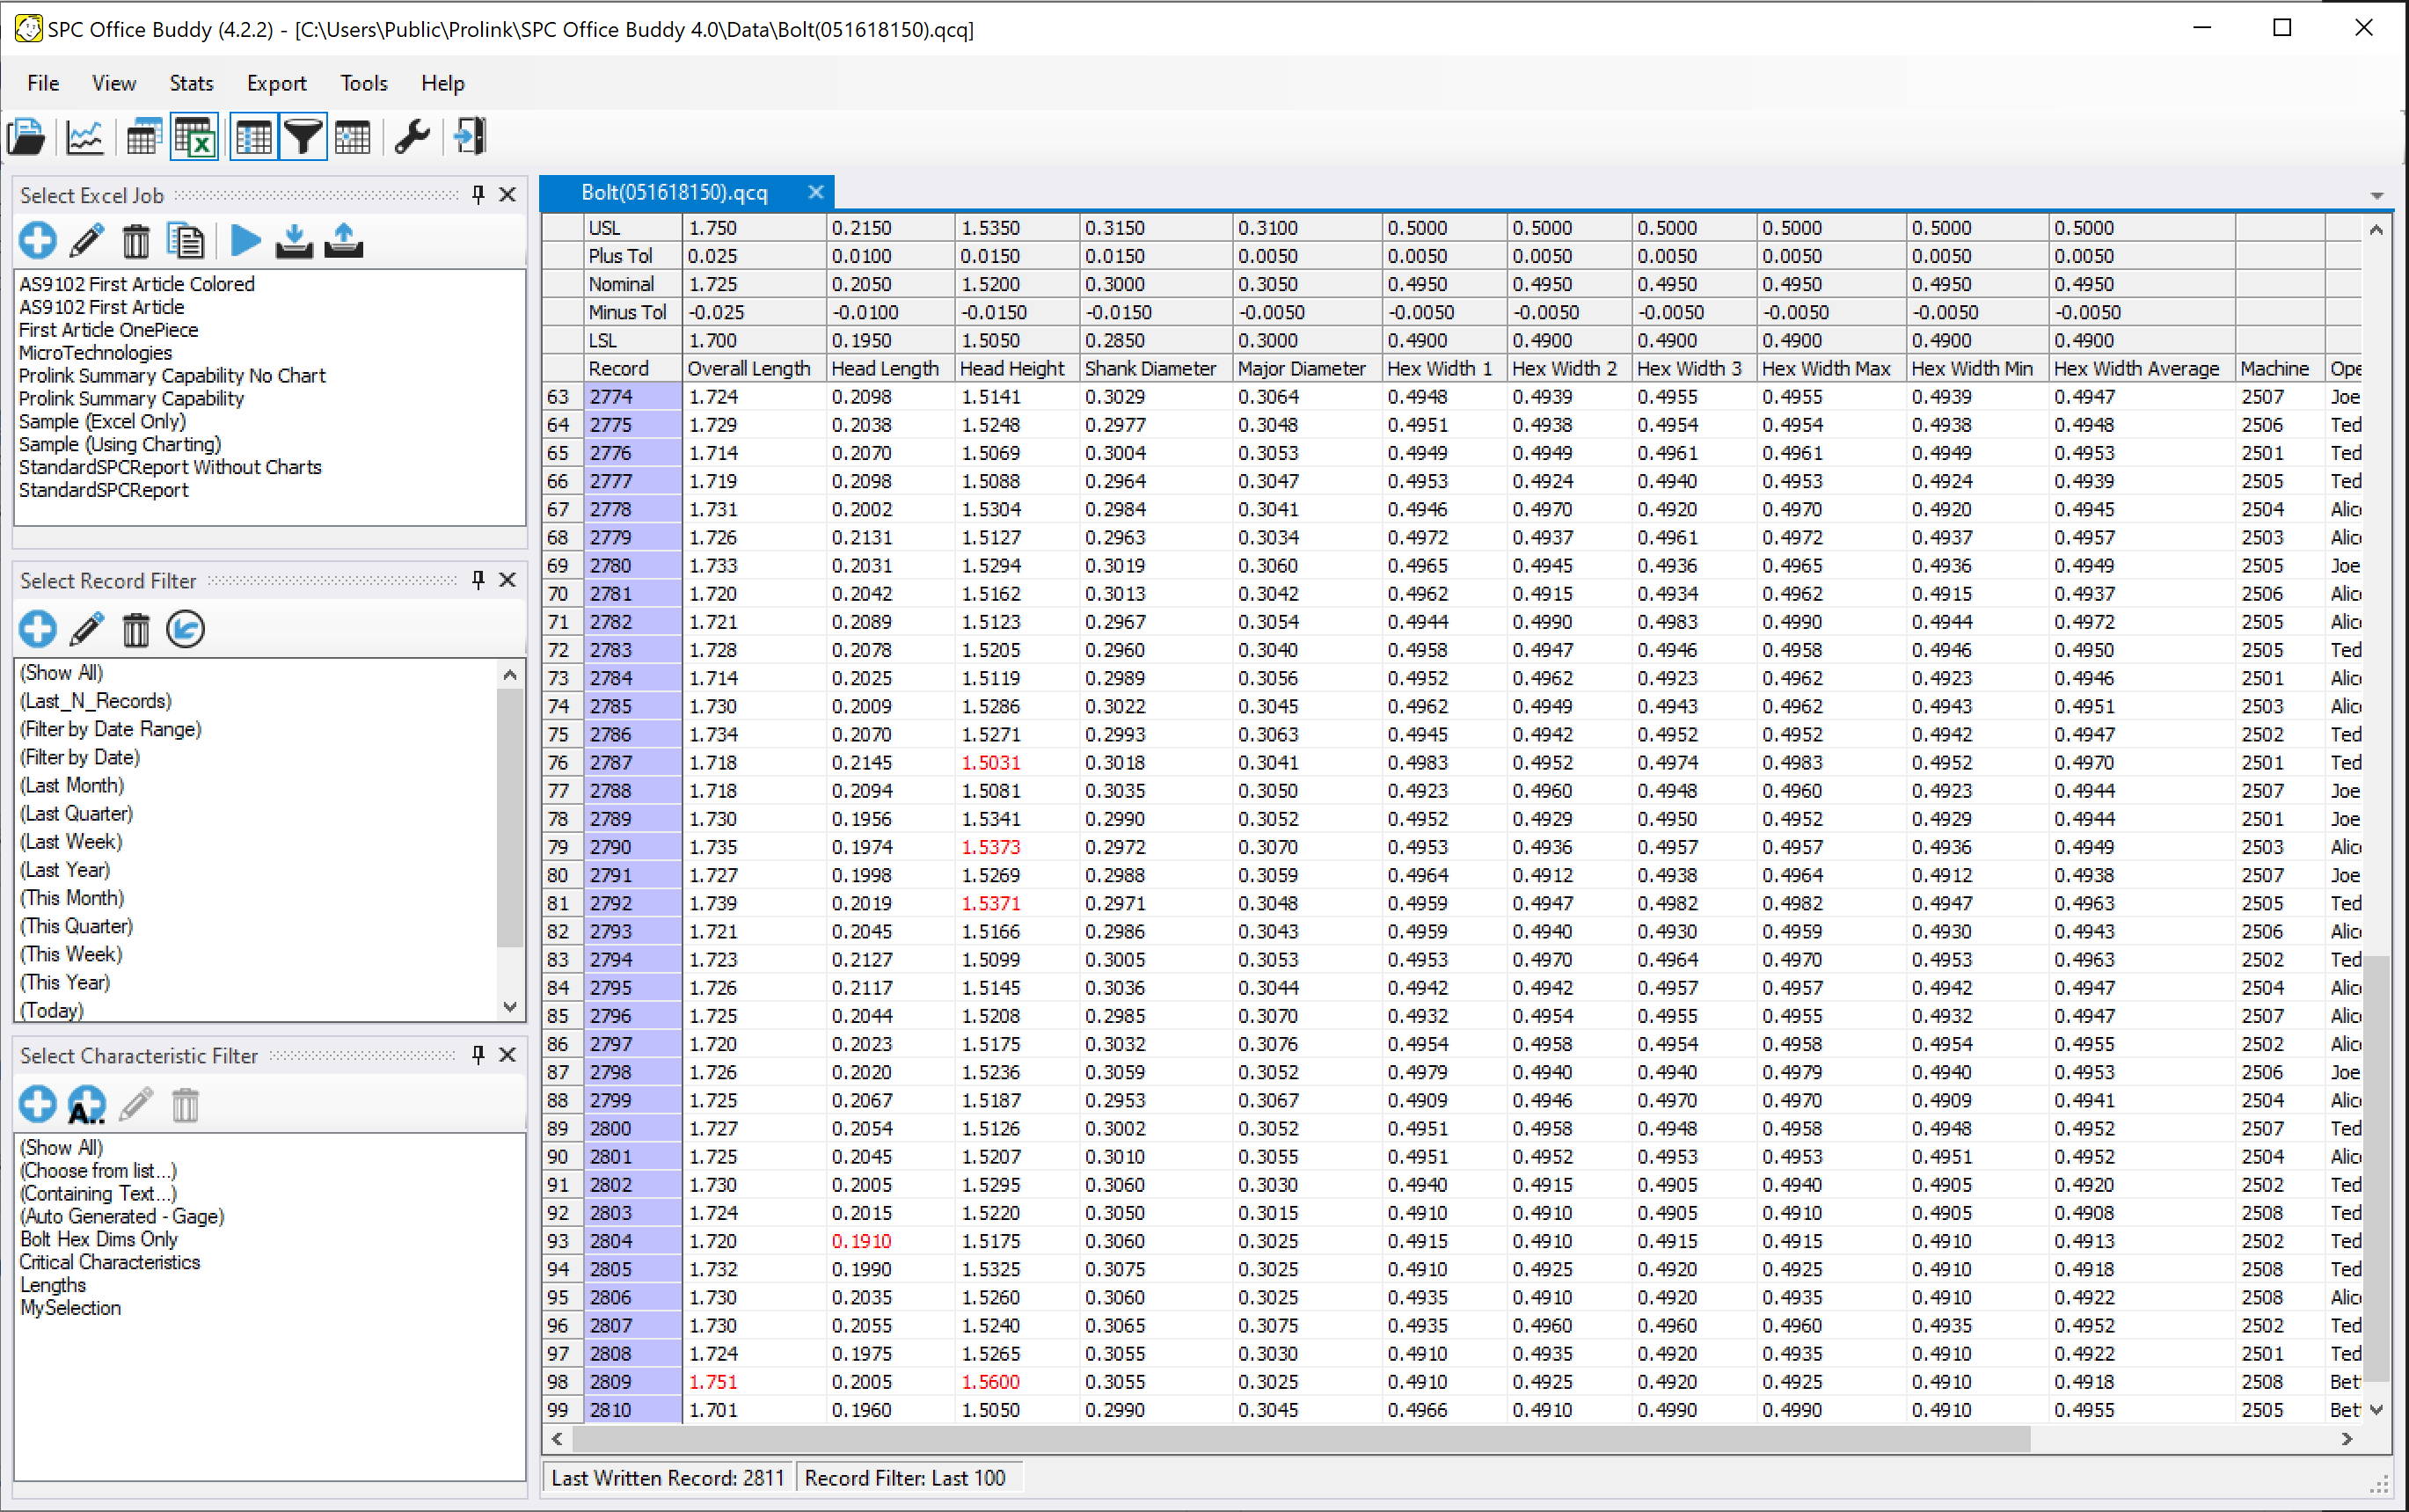
SPC Office Buddy displays your collected measurement data, including PLC data, as a grid of numbers that you filter by both rows (records) and columns (characteristics). Buddy can then run either Prolink Charts or Minitab charts with the click of a button. This saves an enormous amount of time since all nominal and tolerance data is automatically sent to the chart without the need to manually enter it for each characteristic. The data and charts can then be automatically placed into the custom Excel report of your choice in the exact location you specified.
Statistical reports
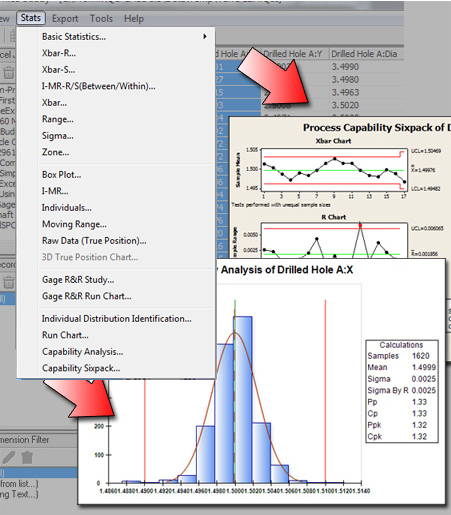
SPC Office Buddy supports a wide range of statistical reports out of the box and more are constantly being added. Running a report is as easy as filtering your data on-screen and choosing a report from the Stats menu. The SPC Office Buddy will take all the data from your screen, export it directly to Minitab and launch the Stats report or Sixpack of your choice.
Want a quick stats report on a subset of your data?! Your Buddy has it covered!
Highlight a set of columns or rows. You can even highlight a set of cells right in the grid. When you choose the Stats report, just specify your selected data in the dialog and you're on your way!
The following are a list of currently supported statistical reports:
- XBar - Range
- XBar - Sigma
- I-MR-R/S
- XBar Charts
- Range Charts
- Sigma Charts
- Zone Charts
- Box Plot
- I-MR
- Individuals
- Moving Range
- Raw Data (True Position) *Prolink Charting ONLY*
- 3D True Position *Prolink Charting ONLY*
- Gage R&R Study
- Gage R&R Run Chart
- Individual Distribution Identification
- Run Charts
- Capability Analysis
- Capability Sixpack/Capability Composite Chart
FULL COLOR CHARTS
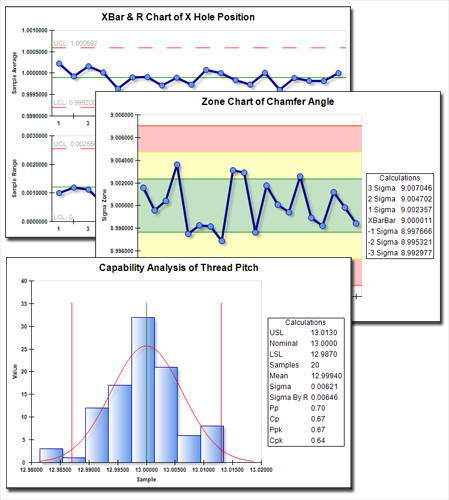
With Prolink Charting, you are only a click away from full color statistical charts. The charting package now comes built-in with the Buddy. All charting in the Buddy is currently supported. This includes the following list.
- XBar & R
- XBar & S
- I-MR-R/S (Between)
- Xbar
- Range
- Sigma
- Zone
- I-MR
Charts in the Prolink Charting package can be resized, copied/pasted into your report, and used in Excel Jobs via the Buddy.
Gage R&R
In addition to the Gage R&R charting, the Buddy can also report your Part Variability, Repeatability, Reproducibility, and Total GR&R statistics as values in your Excel report.
- Individuals
- Moving Range
- Gage R&R Study
- Gage R&R Run Chart
- Run Chart
- Capability Analysis
- Capability Composite Chart
To enable Charting, simply download the SPC Office Buddy 3.4, go to Tools > Options > Chart Settings and choose Prolink Charting from the Chart Tool list.
Statistics
With Prolink Charting, you aren't only limited to charts. You will also have a whole list of statistical calculations at your disposal. Don't spend time setting up your Excel spreadsheet to calculate your statistics by hand. Instead just place tags in your template and replace them with your calculations in seconds. The Buddy currently supports all major SPC statistical calculations including Min, Max, Mean, Median, Range, Lower Control Limit, Upper Control Limit, RBar, Sigma, Sigma By R, Cp, Cpk, Pp, Ppk.
gagestation
GageStation™ is a combination license of both QC-Gage® and QC-CALC Real-Time® for a gage bench.
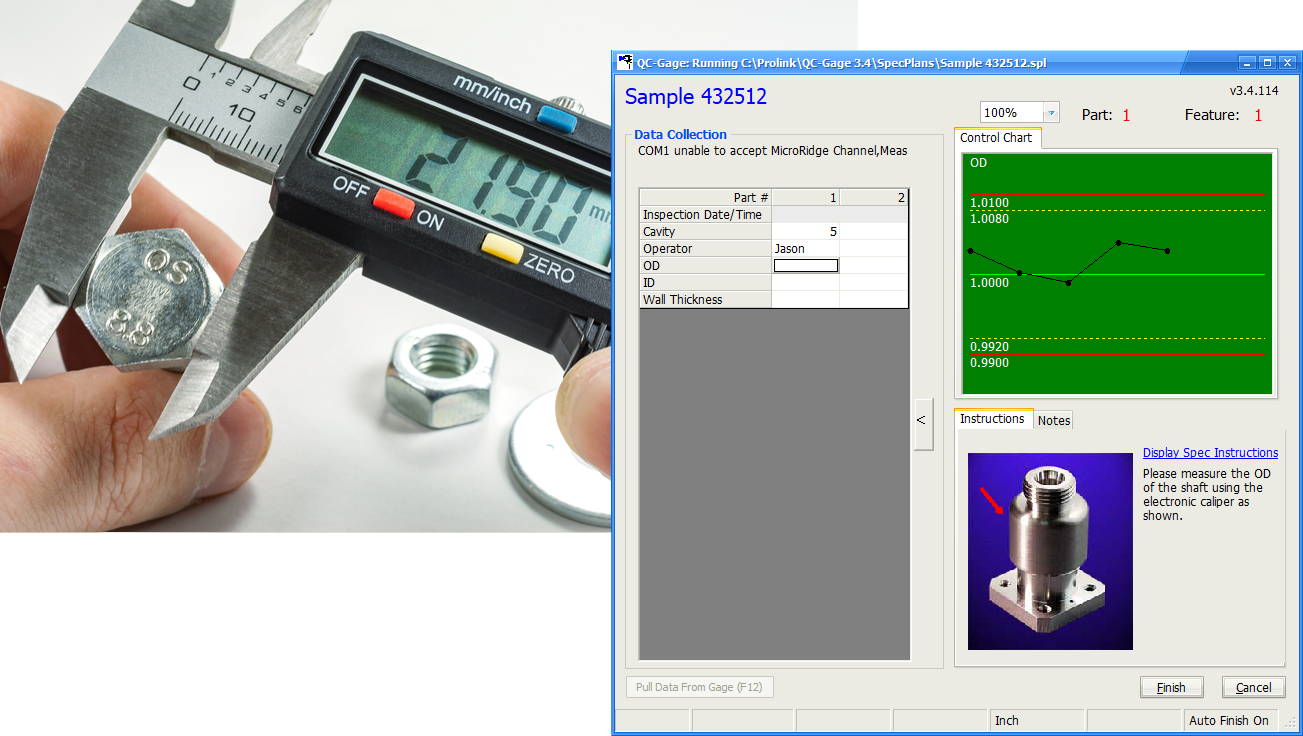
GageStation™ is a full-featured data collection application for use with hand-held gages. Our software allows inspectors to enter measurement data by keyboard or through a direct connection to one or more gages. It displays this data graphically and in table form, and automatically interfaces with QC-CALC Real-Time. Download GageStation™ and start identifying and isolating out-of-conformance parts.
Easily Create Spec Plans for Inspectors
QC-Gage easily creates Specification Plans that lead the inspector through the process of collecting both data and trace information (serial numbers, lots, names, etc). Pictures and directions can be included to help identify exactly what and how each characteristic should be inspected or entered during each step of the process.
Shop Now for QC-Gage Software.
Save and Continue
Use the Save and Continue functionality to save an unfinished Spec Plan and resume measurement at a later time.
Key Benefits
• Easy single-button launch
• Manual Keyboard entry for older dial gages
Interfaces with all electronic gages using:
- RS232
- USB
- File based
- Ethernet / TCP/IP
- GagePort NT®
- Heidenhain MSE1000®
- Solartron® Orbit System
- Marposs USB
- Easy to write Spec Plans provide consistent input
- AQL sampling and inspection groups supported guide users through the inspection process
- Calculated characteristics based on entered values and math equations
- 21 CFR Part 11 support
- Reasonable limit alarms eliminate typos
- File based Spec Plans make copying easy for part families • Link to external documents, pictures, and videos
Graphical Feedback
As inspection occurs current and past data is shown.

Calculated Characteristics
Create characteristics that are based on calculations either on an entered value or on the values of other characteristics.
AQL Sampling
QC-Gage provides support for the ISO 2859-1 AQL sampling standard based on lot size. Standard tables are built in, and custom tables can be created. Provides automatic prompting for quantity to be measured for each characteristic based on lot size to comply with the standard.
Organize Spec Plans
Create buttons that include pictures of the part for easy identification, use the Filtering in Explorer View to narrow down the matching Spec Plan names, or use a barcode to automatically open the correct Spec Plan.

Expandable and Flexible
QC-Gage stores gage definitions in external files so you can add new gages without upgrading the software. A parsing language is available giving the ability to write new interfaces.
Mastering the Gage
Sometimes you need your Spec Plans to master a gage to a known size. Other times you may need to master a gage connected to a GagePort, Heidenhain, etc. Both mastering techniques are available and master values can be stored for each part number.
Import from Ballooning Packages
QC-Gage creates Spec Plans from output from ballooning packages such as InspectionXpert and Discus decreasing the work required to use QC-Gage.
Live Display
Choose from column or radial gages to view the new values being received from GagePort, Solartron, or Heidenhain gages.

Fixture Groups
Read multiple analog probes, LVDTs, or digital gages at once by linking them together in a fixture group. Multiple fixture groups can be added to the same Spec Plan.
Inspection Groups
Reduce the amount of inspection for certain parts within your batch by assigning any of several inspection rules. These include
sequential, custom user selection, and defect rate.

qc-mobile
QC-Mobile is a browser-based web application that brings shop floor quality information to any device. Designed as a companion application to our Enterprise Report Scheduler (ERS), it brings your Reports, Dashboards, Full Views, Live Data, and Statistical Summary to any device on the floor without the need to install software. Plus, it features an industry first QR code linking functionality making it possible for management to access relevant data about a process without prior knowledge of the software.
Imagine posting printed QR codes in each cell throughout your plant that link directly to the current quality results of that cell. Management can then check the status of the cell with their mobile device by simply scanning the QR code. Welcome to the future of SPC!
QC-Mobile uses the popular "card" style to display charts and data making it flexible as the screen size and orientation change. Rather than being a simple set of disparate web pages, QC-Mobile behaves as a connected application allowing you to interactively link between Live Data, Dashboards, Snapshots, Full Views and Statistical Summary.
Shop Now for QC-Mobile Software.

Key Benefits
- Supports all desktop and mobile devices
- Monitor the shop floor from anywhere
- QR code support
- Dashboard slide show with drill down
- Customizable Home screen
- Interactive Full View display
- Viewable across the internet (outside your company)
- Web/network-based means software updates are simple
- No software to install on user’s device
- Supports all screen sizes (desktop, tablet, phone)
- View snapshots of linked 2D/3D CAD images linked through
Browser-based View
QC-Mobile uses the popular "card" style to display charts and data making it flexible as the screen size and orientation change. Rather than being a simple set of disparate web pages, QC-Mobile behaves as a connected application allowing you to interactively link between Live Data, Dashboards, Snapshots, Full Views and Statistical Summary.

Phone Browser-based View
Viewing data on the go is easy. Simply use your phone's browser to view the same charts and data as you move through the shop. QC-Mobile's cards automatically resize and re-orient based on the size of the screen.
Customizable Home Screen
The Home screen contains programmable cards allowing you to change what you are monitoring
QR Codes Make it Easy
ERS generates QR codes that can be posted throughout the factory and act as hyperlinks for QC-Mobile. Scanning these QR codes from any scanner app on a mobile device allows management to get relevant self-serve quality information for any cell in the factory without the need for training.
Stat Summary
The Stat Summary page displays a growing list of statistics and charts at both the record and characteristic level.
Dashboard
The Dashboard page presents interactive dashboards from ERS in viewed from a phone, tablet, or a shop floor touch kiosk, quality a slide show. Each user can monitor different lists of dashboards allowing location-specific overhead monitors to be installed throughout the factory.
Live Data
The Live Data page continuously monitors data, displaying the data in either a summarized view (by record or characteristic) or the familiar real-time plots of QC-CALC Real-Time.
ers
enterprise report scheduler
Enterprise Report Scheduler (ERS) is a reporting system that allows for the creation of interactive charts, data visualization, and deliverables (Reports, Exports, Dashboards, Snapshots, Full Views, and Triggers) across parts and/or plants. Reports and exports can be scheduled and powerful filtering allows detailed data grouping to call back specific details, compare characteristics made on different machines, etc. The real strength of ERS is its ability to provide a top-down view of the overall quality within the factory.
Windows Application or Service
Like other Prolink products, ERS can be run either as an application or as a Windows service ensuring deliverables, such as reports or dashboards, continue to process even when the application is shut down. Services can be grouped and monitored by administrators to ensure timely delivery of content to consumers in the company.
Shop Now for ERS, Enterprise Report Scheduler Software.
KEY BENEFITS
- Entire factory capability in one report
- Ability to compare plants against one another to identify the most capable plant
- Automatic reporting/exporting scheduler for timed reports
- Live, fully customizable dashboards can be displayed throughout the plant
- Full View places hotspots over a map of the shopfloor to instantly see quality issues
- Powerful record and characteristic filtering
- Activate physical andon lights throughout the shop floor for increased visibility
- Link characteristics to 2D/3D CAD drawings for quality callouts
- Trigger actions based on the arrival of data and trends

Exporting of Statistics
Export jobs can be set up to export either raw data or statistical results for downstream usage outside the system. Exports can even be set up to run SPC Office Buddy Excel Jobs for full automation.
Triggered Actions
Triggers allow the monitoring of part files for new data. Upon arrival, triggers can be set to check for specific conditions and/ or trends. If conditions are met, a customizable list of actions (reports, emails, running of scripts, etc) execute creating a logical rules-based system.
Reporting
Although its power lies in scheduled reports delivered to QC-Mobile or the inbox of management, reports can be run manually or automatically. Like QC-CALC, all typical output formats (PDF, etc) are supported as is the ability to customize the report template.
Dashboards
The fully customizable dashboards provide critical real-time information through the use of pictures, charts, and statistics. Widgets are simply dropped onto the surface and linked to data to create stunning displays. Generated dashboard images can then be displayed anywhere in the factory without extra licenses of ERS.
Full View
Similar to dashboards, this live display allows the placement of and on light hotspots on a background image such as a factory blueprint. The hotspots are then linked to measurement data and trend rules to provide instant feedback about the inspection within a particular cell. As trends occur, the and on lights begin flashing yellow or red based on severity of the exception. Hotspots can also optionally flash physical and on lights on the shop floor for more visible notification. Hotspots support drill down capability to find the trend that occurred and optionally run charts on the related data.
Full View hotspots also support drill through, allowing the hotspot state to be representative of an entire separate Full View. Summary Full Views can be created that drill to other Full Views giving management a high level overview with zoom capabilities.
QR Code Linkage
Create reusable QR codes for shortcuts to QC-Mobile. QR Codes can either be normal hyperlinks (requiring login to QC-Mobile) or specialized impersonation codes allowing management to scan and be directed to relevant results without the need to remember login information.
qc-sort
QC-Sort is a nonstatistical, inspection sorting application that is used in conjunction with QC-CALC Real-Time to quickly identify bad parts on a multiple-part inspection fixture. QC-Sort makes it easy for operators to inspect parts remove problem parts from the fixture by using color coded squares to identify the out-of-spec parts. QC-Sort is adjustable and easily configured to display the physical layout of your parts as they are fixtured.
HOW IT WORKS
QC-Sort data sorting software takes the information from QC-CALC Real-Time and looks at it by a set number of parts that you configure. The parts are then laid out to match the specified fixturing. If any feature on a part is out of specification, that part is considered a bad part. QC-Sort displays the corresponding rectangle for that part in red. All good parts are displayed in green.
Partial batches can be handled with a quick adjustment. QC-Sort will automatically display the partial batch and return to normal for the next batch.
Shop Now for QC-SORT.
FEATURES:
Create Your Plan
QC-Sort's major strength is it's ability to look at multi-part fixtures, determine the bad parts, and show you graphically which one are bad. In order to do this, all you have to do is create a Sort Plan. Simply point your Sort Plan to a QCC file, tell it how many parts to look at and specify the general layout of your fixture. To the right is an example where QC-Sort will view the last 20 parts in 5 columns and 4 rows.


Part Layout
In the following screen, specify how the parts are literally laid out (shown at bottom right). For instance, they may be numbered in rows going from left to right or they may be numbered in columns going top to bottom. There are handy Fill buttons at the bottom to automatically fill the rows or columns as you go.
History Panel
The History Panel displays up to 5 past batches on the right side of the screen. Click on the past batch of interest to see it as the main display.
Pictures for Display
Pictures can be used in place of colored rectangles to help operators remove the correct parts from the fixture.
Printed Results
The Auto Print option prints the screen for each batch so the results can stay with the physical fixture.
Measure Your Parts
Once you've specified the layout, you're ready to measure. Measure the parts in your fixture and collect the data in QC-CALC. Then watch as QC-Sort displays the bad parts. Pull out the red ones and send for rework.
Partial Run
Need to measure less than typical? No problem! Simply choose Partial Run from the Tools menu and type the number of parts you will be measuring. QC-Sort will automatically adjust for the next run only and then return to normal.
